The Future of Urban Work

Between 40 and 50 percent of workers in 13 American cities telecommuted in 2021, according to the recently released American Community Survey (discussed here previously). The record is Fremont, California (outside of Oakland), where 48.9 percent telecommuted. More notable, three — possibly four, depending on how you count* — of the 13 cities are central cities, including San Francisco, Seattle, and Washington.

CityStateTelecommuters2021 JobsChange from 2019Change in Transit CommutersChange in Drive Alone Commuting
FremontCA48.9%112,50824,873-81.6%-17.9%
ArlingtonVA48.8%142,653-6,747-79.2%-34.2%
WashingtonDC48.3%353,845-32,033-68.8%-28.9%
BellevueWA48.1%74,006-6,368-80.3%-37.5%
SunnyvaleCA47.1%81,435-3,936-68.0%-45.9%
SeattleWA46.8%438,357-23,131-75.8%-30.8%
BerkeleyCA46.5%57,877-3,989-84.4%-16.5%
San FranciscoCA45.6%438,886-87,136-73.9%-22.8%
CambridgeMA44.4%70,450-816-58.9%-31.4%
CaryNC44.2%91,3932,32037.3%-34.2%
NewtonMA43.9%45,504-579-68.9%-36.0%
BoulderCO42.6%55,376-3,192-72.5%-28.9%
Santa ClaraCA40.2%68,880-6,756-80.1%-42.9%

Most of these 13 cities saw 70 percent or more declines in transit commuters since 2019. The major exception was Cary, North Carolina. However, the survey numbers for Cary are questionable. Transit’s share of Cary workers went from 0.3 to 0.4 percent. Because these numbers are so small, the margins of error are large. The Census Bureau reported 295 plus or minus 233 transit commuters in 2019 and 405 plus or minus 348 in 2021. Since the error terms overlap, the change from 2019 to 2021 isn’t statistically significant. Continue reading

Pandemic Increases Homeownership

The nation’s number of occupied homes grew by 3.9 percent between 2019 and 2021, representing 4.7 million units of new homes, according to table B25032 of the American Community Survey. More than 98.5 percent of those new units were owner occupied, while rental housing grew by just 0.2 percent or less than 1.5 percent of total new homes.

More than three-fourths of new homes were single-family detached homes, reflecting the preferences of most (about 80 percent) Americans for such homes. Another 16 percent were single-family attached (row houses), while only 12 percent were multifamily. Continue reading

July Driving Falls to 97% of Pre-Pandemic Levels

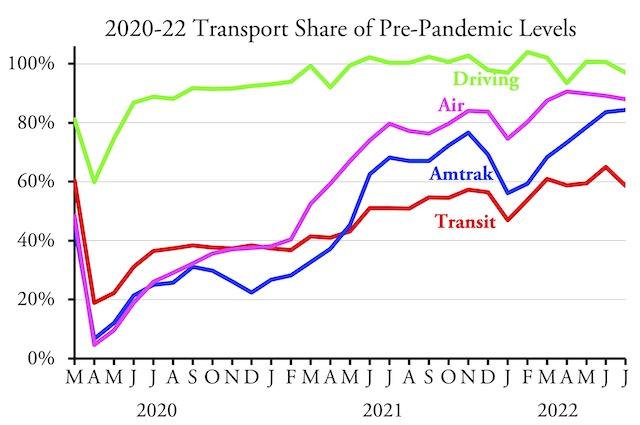
Americans drove 97 percent as many miles in July 2022 as they had in July 2019, the year before the pandemic, according to data released yesterday by the Federal Highway Administration. This is only the fourth month out of the last fourteen in which driving was less than 100 percent of pre-pandemic levels.

See this post for sources of data for Amtrak, air travel, and transit.

The dip in driving in April was explainable by the spike in fuel prices caused by the war in Ukraine. Prices actually peaked in mid-June and have declined almost every day since, so it isn’t clear why driving declined a bit in July. Continue reading

Population and Housing in 2021

The 2021 American Community Survey confirms that major population shifts took place due to the pandemic. But those shifts aren’t necessarily reflected by declines in housing prices in cities and regions that lost population. Indeed, prices rose almost everywhere, and usually faster than incomes.

Americans are moving out of big cities to smaller towns and the suburbs, but so far this hasn’t made big-city housing more affordable.

Numerically, the big loser between 2019 and 2021 was California, which saw the net departure of almost 275,000 people. That was just 0.7 percent of the state’s population, but the only state that lost a greater percentage was Mississippi. Other states that lost residents were Arizona, Louisiana, and West Virginia, plus the District of Columbia lost more than 25,000 people, or more than 5 percent of its population. Continue reading

Census Data Show Transit’s Devastation

More than three times as many people worked at home in 2021 as in 2019, according to data that was released yesterday by the Census Bureau. While this isn’t surprising, the increase in telecommuting had an outsized impact on transit commuting, which declined by more than 50 percent. For comparison, the number of people driving alone to work declined by only 12 percent.

These numbers are from the American Community Survey, a questionnaire that the Census Bureau has sent to about 3.5 million households each year since 2005. Due to the pandemic, the Census Bureau did not do a complete survey in 2020. However, 2021 data are directly comparable to 2019 numbers to get an indication of changes due to the pandemic.

The survey produces more than 1,500 tables about population, race, incomes, housing, commuting, education, and other information. Today, I’ll focus on tables B08103, “Means of Transportation to Work,” B08119, “Means of Transportation to Work by Workers’ Earnings in the Past 12 Months,” B08141, “Means of Transportation to Work by Vehicles in Household,” and B25044, “Tenure by Vehicles in Household.” I’ll write about other tables in future posts. Continue reading

July Transit Ridership Falls Below 60% of 2019

U.S. transit systems carried 58.7 percent as many riders in July 2022 as they did in July 2019, according to data released by the Federal Transit Administration yesterday. This is a major setback from June’s 65.0 percent of June 2019. Of course, the increase in June was due to high gas prices and the decline in July was due to falling gas prices.

Amtrak numbers are from its July performance report. Air travel numbers are based on TSA passenger counts. Highway numbers should be available in a week or so.

Amtrak, meanwhile, has pushed up from 83.6 to 84.3 percent while air travel dropped from 89.1 to 87.9 percent of pre-pandemic levels. The air travel numbers include both domestic and international travel; domestic travel numbers for July aren’t available yet, but the last numbers that were available, for April, stood at 97.2 percent of pre-pandemic levels. Continue reading

May Driving Exceeds Pre-Pandemic Miles

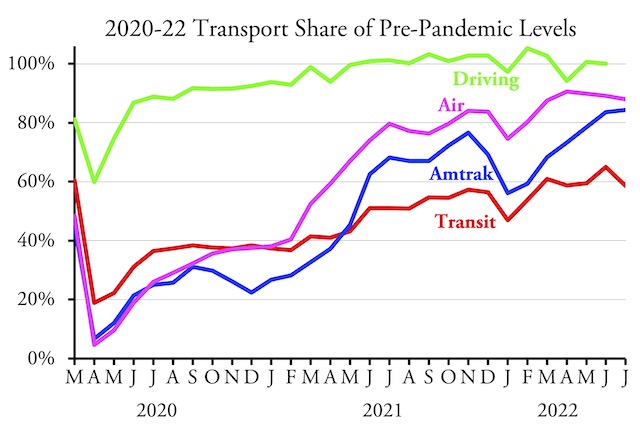
Americans drove almost 288 billion miles in May 2022, compared with 286.4 billion in May 2019, according to data released yesterday by the Federal Highway Administration. This represents a 0.5 percent increase over pre-pandemic levels. Considering that regular gasoline prices were under $3 a gallon in May 2019 and around $4.50 a gallon in May 2022, this suggests that high fuel prices aren’t leading many Americans to abandon autos for transit or other modes.

While transit ridership appears to have plateaued at 60 percent of pre-pandemic levels, miles of driving have exceeded pre-pandemic numbers for most of the last year.

Transit advocates are increasingly promoting free transit for everyone, regardless of income, as a solution to transportation equity issues, when in fact transit practically irrelevant to 95 percent of American workers (including low-income workers) before COVID, and even more since. The real inequity is in low automobile ownership among low-income households, and that inequity can be reduced without giving everyone, regardless of income, free cars.

May Transit 59.5% of Pre-Pandemic Levels

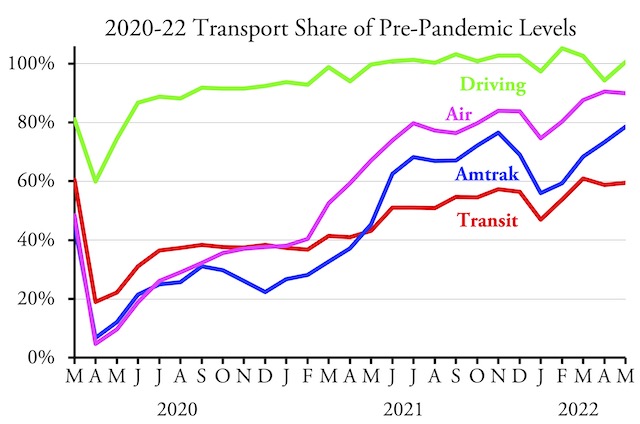
Transit ridership remained below 60 percent of pre-padenmic levels in May 2022, according to data released by the Federal Transit Administration yesterday. This was only a slight improvement over April’s 58.7 percent despite average fuel prices climbing from a little over $4 in April to more than $4.50 in May.

Amtrak passenger miles, meanwhile, reached 78.5 percent of May 2019, a 5 percent climb from April. Air travel remained right around 90 percent of pre-pandemic levels. Driving data will be released later this month. Continue reading

April Transit Falls to 58.7% of Pre-Pandemic Levels

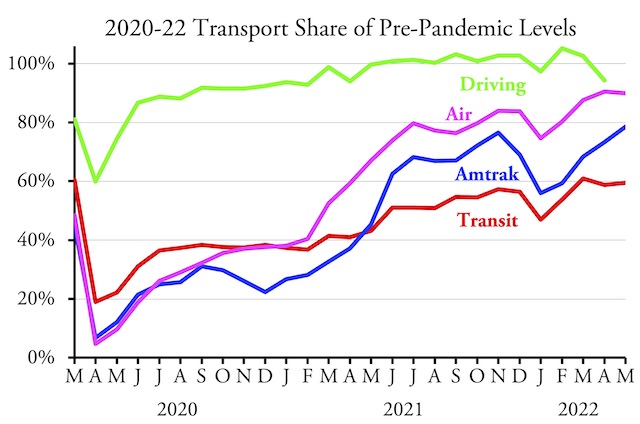
Transit ridership in April 2022 was 58.7 percent of April 2019, according to data released yesterday by the Federal Transit Administration. This is down from March, when ridership was 61.0 percent of March 2019. When I reported on March numbers, I predicted that April’s numbers would fall below 60 percent of pre-pandemic levels because April 2022 had one fewer business day than April 2019, while March had two more than in 2019.

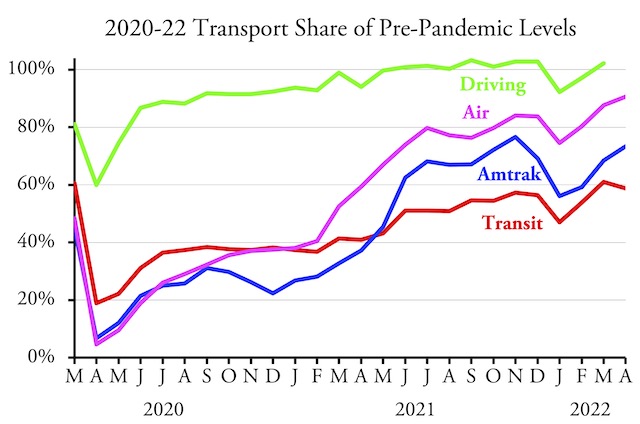
While airline and Amtrak numbers grew in April (as a percent of 2019 levels), transit numbers fell.

For comparison, airline numbers exceeded 90 percent of pre-pandemic levels (which I also predicted) while Amtrak ridership grew to 73 percent (though that’s a drop from November, when ridership was more than 77 percent of November 2019). Driving numbers won’t be out for another week or so, but will probably be around 100 percent. Continue reading

March Driving 2% More Than Before the Pandemic

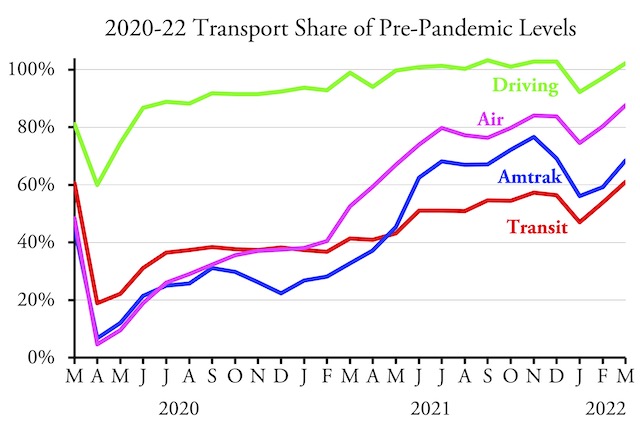
Americans drove 2.1 percent more miles in March 2022 than in March 2019, thus returning to more than 100 percent of pre-pandemic levels, according to data released late last week by the Federal Highway Administration. Driving first exceeded 100 percent of pre-pandemic in July 2021 and remained above 100 percent through the end of the year. It then dipped below 100 percent in January and February, but now is back above 100 percent.

See this post for sources of data for air, transit, and Amtrak.

As noted here before, air travel is approaching 90 percent of pre-pandemic levels, while Amtrak is still below 70 percent and transit has just barely breeched 60 percent. I suspect transit will fall below 60 percent in April as March 2022 had two more work days than March 2019 while April 2022 had one fewer work day than April 2019. Continue reading