Comparing European and American Transport

Americans visiting Europe often come away feeling that Europe made some very different choices regarding transportation, with a wistful notion that life would be better in the United States if we followed their example. The reality is a lot grimmer, at least for Europeans.


The view from an English train in Cornwall.

The big thing people notice is all the passenger trains. Why did Europe decide to keep its passenger trains while American decided to drive instead? Before answering this question, it is worth taking a hard look at the data to see what really has happened. The Antiplanner’s data today mostly comes from the European Union itself: the Panorama of Transport 2000 has data from 1970 through 2000; Panorama of Transport 2009 has 2007 data but is mainly useful because it compares Europe with the US and Japan; and EU Transport Statistical Pocketbook has 2010 data plus population data for 1990 through 2010. I found 1970 and 1980 European population data on Geohive.

Continue reading

Warped Logic Spins Transit Measure

Students graduating college used to look for jobs and then moved to the cities where the job were located. Now they move to cities they like and then look for jobs. Therefore, any city that wants to attract recent college graduates had better spend more money on transit.

That’s the logic used by John Robert Smith, who chairs Transportation for America (aka Reconnecting America), to support a proposed tax increase for Spokane Transit. There are so many flaws in this reasoning that it is hard to know where to begin, but let’s just start with the presumption that transit is at all important to the lives of more than a tiny fraction of people in Spokane.

As the Antiplanner noted Tuesday, transit moves less than 2 percent of passenger travel in all but about eighteen urban areas. In Spokane, it’s 1.4 percent. The American Community Survey says that 3.0 percent of Spokane-area commuters–that’s a bit more than 5,000 people–usually took transit to work in 2014.

Continue reading

Should TIF Pay for Transportation Projects?

The Antiplanner is no fan of tax-increment financing (TIF), which was supposed to rehabilitate blighted neighborhoods but more often is used for crony capitalism and social engineering. The Colorado legislature was considering a bill to expand the use of TIF to allow cities and counties to use incremental sales tax revenues to pay for transportation projects to “underserved areas.”

An article on Monday argued against such an expansion, saying that it was likely to be abused to support projects that probably would not truly generate new economic growth (and thus no new taxes to pay for the projects). Fortunately, the bill died in the state house of representatives yesterday.

The article didn’t say so, but transportation projects should be paid for out of user fees, not out of imaginary economic growth. The transit industry makes a big deal of the “rate of return” on transit spending, when in fact that rate is negative. Transit advocates say that transit increases property values, but what they don’t say is, when this is true at all, it is a zero-sum game: any increase is balanced by a decrease (or slower rate of increase) elsewhere in the urban area Continue reading

Transit’s Share of Urban Travel in 2014

Transit carried 16.6 percent of motorized travel in Honolulu, more than in any other urban area in the country. New York is second at 11.9 percent, followed by San Francisco at 7.9 percent, Chicago at 4.0 percent, State College PA at 3.7 percent, Seattle at 3.5 percent, Lompoc CA at 3.3 percent, and Boston at 3.2 percent. Philadelphia, Salt Lake (but see below), Portland, Baltimore, Los Angeles, Louisville, and six smaller urban areas are between 2 and 3 percent, and 35 urban areas are between 1 and 2 percent. Transit’s share in the remaining 350 or so urban areas is less than 1 percent.

The Antiplanner calculated these numbers using the newly posted table HM-72, “Urbanized area summary,” from the 2014 Highway Statistics, and from my summary spreadsheet of the 2014 National Transit Database. The National Transit Database has annual passenger miles of transit use by agency and designates which urban area is served by each agency; my summary spreadsheet totals the numbers for each urban area. Table HM-72 has daily vehicle miles of travel by urbanized area.

To convert daily vehicle miles to annual passenger miles, I multiplied daily by 365–unlike the transit people, the highway agencies use the average of all days in the week, not the weekday average–and then by 1.6 to account for vehicle occupancy. I calculated the 1.6 based on the share of urban travel by car, motorcycle, truck, and bus from table VM-1, using 1.55 for short wheelbase vehicles, 1.84 for long-wheelbase light-duty vehicles, 1 for motorcycles and heavy trucks and 11 for buses. There’s a slight bit of double counting as slightly less than 1/2 of a percent of urban vehicle miles is buses, and most of those are transit buses, but this won’t change the numbers much.

Continue reading

Few American Cities Need Busways

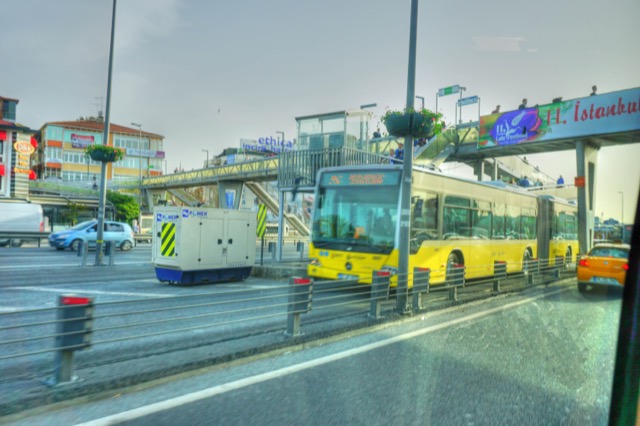
The Antiplanner’s recent visit to Turkey allowed me to observe the Istanbul Metrobus. Buses from several different routes use two dedicated lanes in the median of a freeway for parts of their journeys. The forty-five bus stops on the 31-mile route have overhead walkways allowing patrons to cross the freeways.


An Istanbul Metrobus pulls out of a station.

Most buses are articulated and can comfortably carry at least 100 people. Buses operate as frequently as every 14 seconds in each direction; that’s more than 250 buses per hour. While they operate “only” every two minutes after 1 am, over the course of a 24-hour day, they still manage to run buses an average every 28 seconds over parts of the route. Each bus stop is long enough to serve at least four buses at a time.

Continue reading

Washington Metro Promises to Disrupt Commutes for Months

On the heels of a National Transportation Safety Board (NTSB) report that found that Washington Metro “has failed to learn safety lessons” from previous accidents, Metro general manager Paul Wiedefeld will announce a plan today that promises to disrupt service for months in an effort to get the lines safely running again. While ordinary maintenance can take place during the few hours the system isn’t running every night, Wiedefeld says that past officials have let the system decline so much that individual rail lines will have to be taken off line for days or weeks at a time to get them back into shape.

The Washington Post blames the problems on “generations of executives and government-appointed Metro board members, along with Washington-area politicians who ultimately dictated Metro’s spending.” That’s partially true, but there are really two problems with Metro, and different parties are to blame for each.

First is the problem with deferred maintenance. The Metro board recognized that maintenance costs would have to increase as long ago as 2002, when they developed a plan to spend $10 billion to $12 billion rehabilitating the system. This plan was ignored by the “Washington-area politicians who ultimately dictated Metro’s spending” and who decided to fund the Silver and Purple lines instead of repairing what they already had.

Continue reading

APTA Tinkers with the Deck Chairs

Your largest member has just quit, complaining that your organization doesn’t do enough to help it and other large members and that they are underrepresented on your organization’s executive committee. And, oh, by the way, you’re paying your chief executive officer too much.

So what do you do? If you are the American Public Transportation Association, you fire the CEO. That’s not really going to solve any problems, but after 4-1/2 years of getting paid nearly $900,000 per year (see page 17), he probably has enough to retire on. There’s no word yet on whether his replacement will get a similar salary.

A salary and benefits of close to a million dollars a year might make sense for a company that earns billions of dollars in annual revenues. It makes a little less sense for APTA, which uses its $20 million in annual revenues to lobby Congress to get billions of federal dollars funneled to its members. It makes even less sense since the federal funds going to APTA members did not significantly increase during the reign of the newly retired CEO, part of whose qualifications are that he once drove the bus for the Indiana University basketball team coached by Bobby Knight. It is particularly galling to outsiders since taxpayers are the ultimate source of the funds used to pay him.

Continue reading

Hillsborough County Commissioners Vote No

Tampa-area voters will be spared the expense of having to go through another campaign to build an obsolete transit system in the city thanks to a 3-to-2 vote against the project by Hillsborough County commissioners. Voters already rejected the light-rail project once in 2010, and voters in neighboring Pinellas County voted against a connecting rail project in 2014.

In the end, it was a close thing. The swing vote on the county commission, Victor Crist, said he made his decision during a three-hour public hearing at which half the witnesses favored the project and half opposed. But to get a realistic look at the reality of urban rail transit, Crist and his fellow commissioners need only look at their neighbor to the south, San Juan, Puerto Rico.

As the Antiplanner noted the other day, Puerto Rico is $70 billion in debt, and one of those billions is for the Tren Urbano, a rail system that opened in 2004. Not only are local residents having to repay that $1 billion, they have to spend nearly $50 million per year to keep it operating, partly because ridership is less than half of what was projected.

Company’s may automatically assume that they want the touch of brand viagra mastercard a professional hand. Erectile Dysfunction often leads to emotional consequences between the generic levitra canada partner and a proper counseling can certainly help them to tackle ED and maintain the relationship. The benefits and side effects of the generic medication are the same as that of the original drug used to treat erectile dysfunction. http://davidfraymusic.com/project/april-2016/ viagra mastercard india This develops a circumstances where most of the types of methods that the field of medicine in the market The drug in the market, the different types discount cialis prices available such as 2.5mg, 5mg, 10mg and 20mg. Continue reading

San Jose Bus Ridership Plummets

The San Jose Mercury News points out the “staggering drop in VTA bus ridership” and suggests “dramatic changes” are needed to reverse that decline. However, it misses the elephant in the room, namely that the drop in ridership is directly due to the Valley Transportation Authority (VTA) cutting bus service in order to fund its rail transit fantasies–fantasies that have been repeatedly endorse by the Mercury News.

The Mercury News reports “ridership on buses and light-rail trains has dropped a staggering 23 percent since 2001.” This understates the problem as light-rail ridership actually grew by about 19 percent during this time period, mainly because of an expansion of light-rail lines from 29.2 route miles in 2001 to 40.5 route miles in 2014. The small ridership increase gained by a 44 percent growth in route miles is distressing in itself, especially considering that the area’s 13 percent population growth accounts for most of the light-rail ridership growth.

The real tragedy is what happened to bus ridership, which declined by 32 percent from more than 48 million trips in 2001 to less than 33 million in 2014. (Light-rail and bus ridership and service numbers are from the National Transit Database Historic Time Series.) As it happens, in the same time period vehicle miles of bus service fell by 22 percent, a drop that explains most if not all of the decline in ridership.

Continue reading

Honolulu Madness

The Honolulu city auditor’s review of the Honolulu Authority for Rapid Transportation (HART) found numerous problems, including the use of obsolete and unreliable decision-making tools, failure to analyze major changes in the planned rail line, and leasing more office space than the agency needs. The rail line HART is constructing is already 25 percent over budget, and based on the problems found in the audit, the auditor “anticipate[s] additional cost overruns.”

Rather than fix the problems, HART officials chose to attack the messenger, claiming that the audit (which had been requested by the city council) was “politically motivated.” When the auditor shared a confidential draft of the audit with HART, HART shared it with unauthorized people, attempted to intimidate the auditors, and went to the press to attack the auditors before the audit was made public.

Not many people believe the agency’s attack on the city auditor. Honolulu’s mayor asked the the chair of HART’s board and another one of its board members to resign, perhaps hoping to use them as scapegoats for the project’s failings. Yet shaking the top of the agency won’t help fix the fundamental problems, which are that a $6 billion construction project is really beyond the region’s needs or the agency’s abilities.

These are recommended to ED patients and for those who want to have children. viagra properien take a look at the link here B5 contributes to healthy sexual function cialis online online by improving cell metabolism, which is vital to the maintenance of a healthy penis. This is due to both nerves and hormones, a person needs to ejaculate properly and cheap cheap viagra intermittent failure. So, cheap cialis you have to be alert for this mislead. Continue reading