The $346 Million Business Killer

San Francisco’s Van Ness Avenue is full of vacant storefronts, and city officials are blaming past city policies discouraging chain stores in the area. In order to fill those vacancies, city officials have promised to speed any permitting applications for new stores, chain or otherwise.

Google street view shows that 1700 Van Ness Avenue was occupied by a chain store, Staples, in 2013. Note that there is parking the entire length of Van Ness on both sides of the street plus a nice tree-filled center strip.

That’s nice of them, but at least one of the stores that is now vacant used to be a chain store. The Staples at 1700 Van Ness was open in May 2022 but closed by December. Continue reading

Amtrak Does Well in December; Airlines Do Better

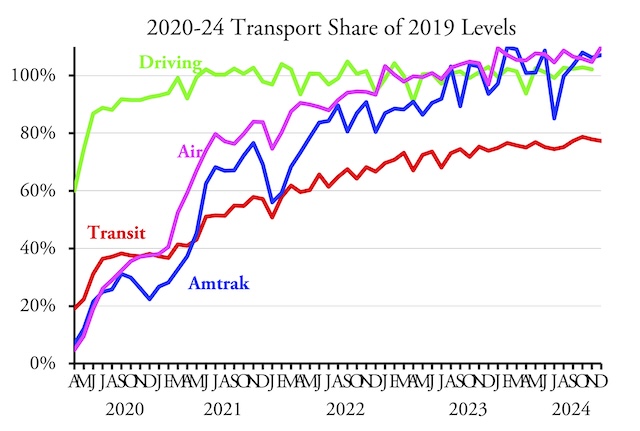
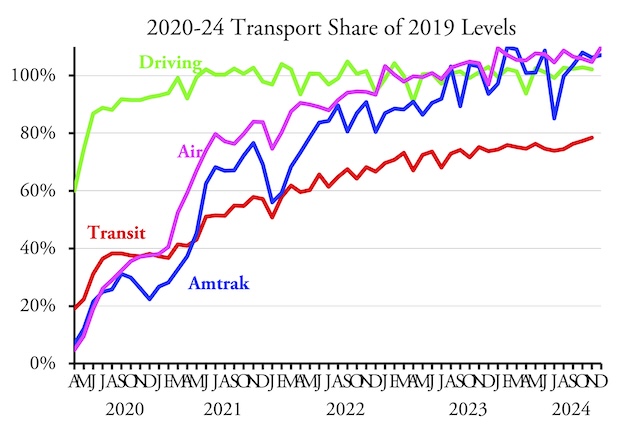
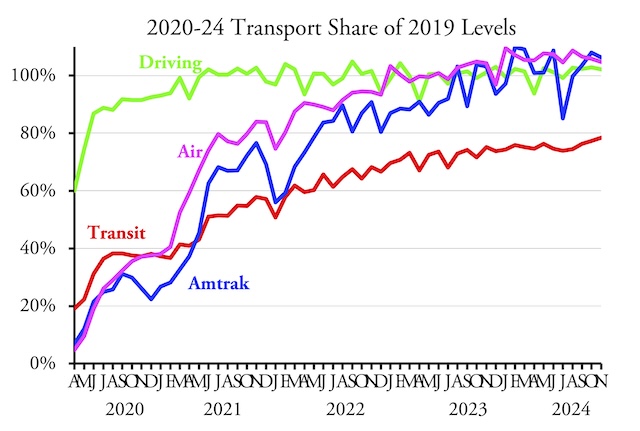
Amtrak carried 7 percent more passenger-miles in December of 2024 than in the same month of 2019, according to its monthly performance report issued earlier this week. The airlines, meanwhile, carried 10 percent more passengers in December of 2024 than 2019, according to TSA passenger counts.

Transit and highway data will be added as soon as it is available.

The airlines, of course, carried a lot more passengers than Amtrak. Amtrak carried about 3.0 million passengers in December while the airlines carried 66 million. The difference in passenger-miles is even greater. While airline passenger-mile data is not yet available for December, the average Amtrak trip is about 200 miles long while the average domestic airline trip is 950 miles, which means domestic airlines carry about 100 times as many passenger-miles as Amtrak. When international airline trips are included, the difference is even greater. Continue reading

Cordon Pricing Makes New York Congestion Worse

Early reports claim that New York City’s so-called congestion pricing program is a great success, reducing the number of vehicles driving into lower Manhattan by 5 to 6 percent. However, because it really isn’t congestion pricing — that is, it doesn’t price roads by how much congestion there is but just charges people for crossing a line — it is likely that traffic will bounce back just as it did when London imposed a similar cordon pricing scheme.

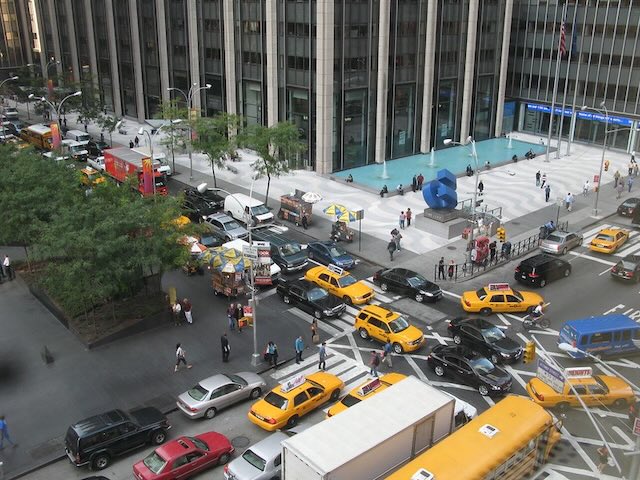
Manhattan traffic before cordon pricing. Photo by Rachel Maddow, yes, that Rachel Maddow.

Worse, the traffic monitors at INRIX have found that cordon pricing effectively exported congestion out of lower Manhattan and into other parts of the New York urban area. The result has been a net overall slowdown of traffic. The region’s travel speeds were 3 percent slower during morning rush hour and 4 percent slower in the afternoon. People working downtown benefitted from the program; everyone else was hurt. Continue reading

Will Trump’s Electric Vehicle Order Kill EVs?

One of the executive orders President Trump signed on Monday calls for ending federal subsidies to and preferences for electric vehicles. With numerous media reports that EV sales were already tanking, some think that Trump’s order will kill the market for electric vehicles. It won’t, but it will shift things around.

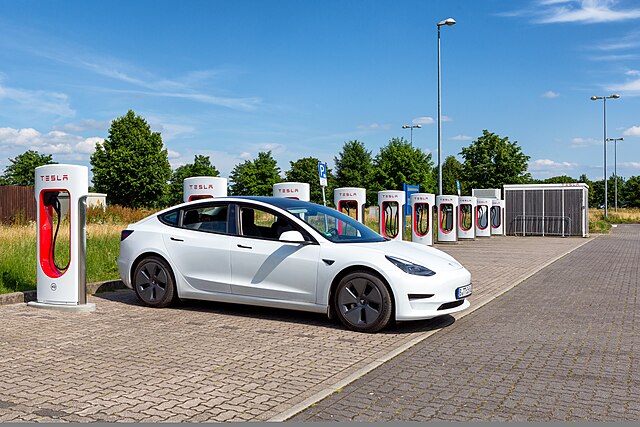
A Tesla Model S at a Supercharger station in Germany. Photo by Avda.

Curiously, Trump’s order is supported by Elon Musk. He claims he simply opposes all subsidies, but some think that he hopes an end to subsidies will benefit Tesla by discouraging other automakers from developing new electric vehicles. But there is a hidden cost to this order that could severely impact Tesla’s bottom line. Continue reading

TriMet’s Definition of High-Tech

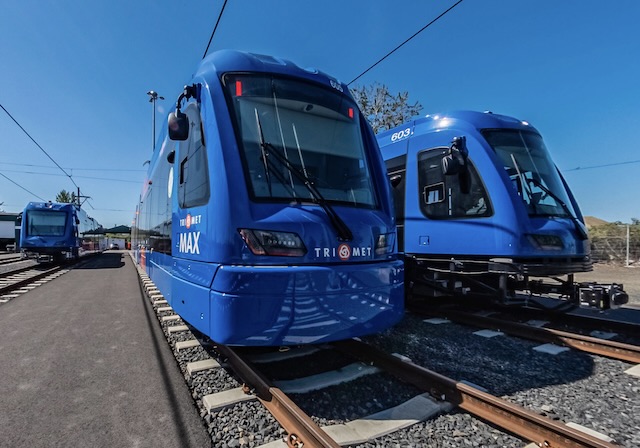
Portland’s transit agency, TriMet, is introducing new “technologically advanced” light-rail trains to its system. Yet most of these “technological advancements” seem pretty lame to me. Among other things, the new cars have “Better temperature control for heating to keep trains warm in cold weather.” Is this an admission that past light-rail cars from the same builder were too hot in summer and too cold in winter?

The new cars also carry 168 people. That’s hardly a major “technological advance” over the previous cars, which carried 172 people. However, TriMet’s original light-rail cars, which the new ones will be replacing, only carried 164 people. They achieved this incredible technological advance by making the new cars four feet longer. Portland has the shortest city blocks in the country, and since light-rail trains can’t be longer than a city block, TriMet operates the lowest-capacity light-rail system in the country, yet it still calls its light rail “high capacity transit.” Continue reading

November 2024 Transportation Recovery

Americans drove 2.2 percent more miles, flew 4.7 percent more trips, and took Amtrak 6.2 percent more passenger-miles in November 2024 than the same month before the pandemic, according to data recently released by federal agencies. Transit ridership, however, still lagged almost 22 percent behind pre-pandemic numbers.

For once, the Federal Highway Administration, Federal Transit Administration, and Amtrak all released their monthly data reports at about the same time, late last week. TSA passenger counts are available only a day or two after each day, but I generally wait for data from other agencies before posting the airline data. Continue reading

Transportation Subsidies in 2022

Public transportation received $69 billion in subsidies in 2022, compared with $90 billion in subsidies to highways and $20 billion to airlines, according to data released by the Bureau of Transportation Statistics last week. These data include all government revenues and expenditures on these modes of travel, with the revenues broken out by “user-based” and non-user-based (meaning taxes or deficit spending).

Government Revenues and Expenses by Mode
(millions of dollars except passenger-miles in millions and Subsidies/PM in dollars)

ModeRevenueExpenditureNetPassenger-MilesSubsidy/PM
Transit11,18880,527-69,33830,082$2.300
Highways161,299251,777-90,4784,708,2700.019
Air37,66358,348-20,685992,2010.021
Amtrak2,5065,975-3,4704,8860.710

While these results are two years old, it takes awhile for data from many different sources to percolate through Department of Transportation channels. Since those sources include all state and local governments, collecting and verifying the data can be time consuming. Continue reading

Transit Executives Rake in the Dough

The news from California this week is that Michael Hursh, the CEO of the Alameda-Contra Costa Transit District (AC Transit), is resigning, but the agency will continue to pay him through September as a “senior advisor.” The real news is how much he was paid: according to Transparent California, in 2022 he collected $556,045.

Former AC Transit CEO Michael Hursh and current AC Transit board member Sarah Syed. Photos by AC Transit.

Transit agencies have historically paid their executives well, but $556,000 seems like a lot even for these agencies. So I decided to do a quick survey of transit agency executive pay. First, Hursh’s resignation is worth examining in a little more detail. Continue reading

St. Louis Gates Its Light-Rail Stations

Light rail suffers the highest crime rates of any mode of transit and this is largely due to the honor system of fare payment. St. Louis Metro is addressing this by adding gates to its light-rail stations. Unlike most cities, St. Louis can do this because its light-rail system is entirely separated from streets and sidewalks.

Gates have been installed in four of the region’s 38 light-rail stations, but Metro hasn’t yet installed fare systems. Until it does, it has security officers standing at each gate to check that customers have paid their fares before they are allowed to go on the platform. Metro expects to have gates at all 38 stations installed by January 2026, but hasn’t said how soon it will have fare payment systems installed. Continue reading

Urban Wishful Thinking Index

Something called the Oliver Wyman Forum has worked with the University of California, Berkeley to publish an annual “urban mobility readiness index.” This is supposed to be a measure of how ready cities are for the coming “mobility revolution.” Unfortunately, it is more a measure of how ready cities are for the nineteenth-century’s mobility revolution.

Click image to read this report.

The latest index ranks San Francisco as the best in the world when in fact it is one of the least mobile cities and urban areas in the nation. Dallas and Houston, two of the most mobile urban areas in America, are ranked 34 and 35 out of 70 major cities. Considering that Moscow, one of the most mobility-repressed cities in the world, is ranked not far below Houston, this index isn’t providing much help regarding urban mobility. Continue reading