Transit Lies & Deceptions

Recent panels with the Antiplanner and several transit advocates exposed some disagreements that are legitimately difficult to prove one way or the other. For example, Jarrett Walker thinks that there is a pent-up demand for dense urban living and I don’t, but government regulation has so screwed up housing markets that it is hard to prove who is correct.

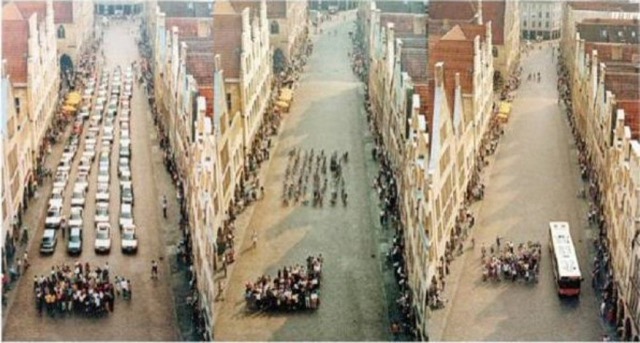
These photos are a lie. (Click image for a larger view.)

At the same time, the transit advocates made some claims that are easy to prove wrong. For example, one said that a two-track rail line can move as many people as a sixteen-lane freeway. Another used the above photos to show that a bus uses far less space to move people than cars. Both of these claims are highly deceptive. Continue reading

Putting Transit Over People

A southern California elected official is challenging the notion that the region can solve its congestion problems by putting more money into transit. Richard Bailey, the mayor of Coronado, has written an op ed titled “It’s time to put roads over transit.” Bailey argues that it is wasteful to put more than 50 percent of the San Diego region’s transportation dollars into transit when transit carries just 3.5 percent of the region’s commuters. He hopes to influence the urban area’s next regional transportation plan.

Bailey’s article caught the attention of a local news station that also interviewed transit advocate Colin Parent (starting at 1:05). Parent noted that there are 64,000 households in San Diego County that don’t have a car and cutting transit would hurt those people who use it as “their primary means of transportation.” Continue reading

High-Speed No

It seems like every article about a ridiculous high-speed rail proposal starts out with something like, “Imagine stepping on a train in Portland at noon and stepping off about two hours later in Vancouver, British Columbia.” What a great imagination you have, Andrew Theen of the Oregonian!

How about this: imagine stepping aboard a plane at Portland International Airport at 10 am and landing in Vancouver a little more than an hour later. You don’t have to imagine it because you can do it! One-way fares are under $150, which is a lot less than it would cost to build a high-speed rail line between the two cities.

Of course, someone is going to say that the downtown-to-downtown time of the train will be competitive with flying. But most people don’t live downtown anymore, so that is really irrelevant. Those who do can take light rail to the Portland Airport and the Skytrain to downtown Vancouver. Driving would be quicker, but no one who lives in Portland ever drives anywhere, do they? Continue reading

Watch Romance of the Rails Live

Today, the Cato Institute releases Romance of the Rails with a forum that starts at 11:30 am Eastern and continues to 1:30 pm. The Antiplanner will introduce the book, followed by comments on the book from Art Guzzetti of the American Public Transportation Association; Jim Mathews, of the Rail Passengers Association; and Marc Scribner, of the Competitive Enterprise Institute. If you can’t be in Washington DC this midday, watch it live here.

I don’t know if this is my best book yet, but it was the most fun to research and write. With so many railroad history books out there, I didn’t think I would be able to write something that hadn’t already been written a hundred times. In fact, I think a lot of the history in the book — and the book is more than half history, less than half policy analysis — will be new to even many ardent rail fans. Continue reading

August Transit Ridership Drops 1.7%

Nationwide transit ridership in August 2018 was 1.7 percent below the same month in 2017. Heavy rail dropped by 1.5 percent; light rail by 2.3 percent; buses by 1.9 percent; and streetcars by 11.2 percent, according to monthly data released last Friday by the Federal Transit Administration. Commuter rail gained 0.5 percent and hybrid rail gained 34.1 percent, mainly due to the opening of a new line of that type in Oakland.

Transit ridership had grown slightly in July, mainly because of depressed 2017 ridership due to New York City’s “summer of Hell” (meaning the partial closure of New York City’s Penn Station) and Washington DC’s “SafeTrack” program, both of which caused many transit delays. Although the Penn Station closures continued through August, 2017, the improved conditions in August 2018 weren’t enough to prevent New York urban area August ridership from declining by 0.5 percent.

August ridership declined in 36 of the nation’s top 50 urban areas. Ridership grew 27 percent in Houston, mainly because it had been depressed in August 2017 by Hurricane Harvey, which pretty much shut down the city for the last week of the month. It grew by a paltry 0.4 percent in Washington due to being depressed by the SafeTrack program in 2017. Continue reading

How Many Really Commute by Transit?

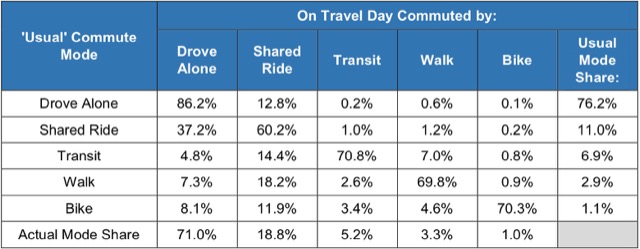
According to the 2017 American Community Survey, about 7.6 million Americans, or 5.3 percent of commuters, take transit to work. However, the actual question on the survey asks, how do you “usually get to work last week.” If someone took transit three days and drove two, then transit gets checked. So how many really use transit on any given day?

Fortunately, table 26 in the 2017 Summary of Travel Trends from the National Household Travel Survey helps answer this question. This survey asked both how people usually got to work and how they actually got to work on a particular day. The above table is a crosswalk showing that people who say they usually drove to work actually drove about 98 percent of the time, but people who say the usually take transit actually took transit only about 71 percent of the time. Carpooling was the big winner because people who say they usually took another mode most often carpooled when they didn’t use that other mode. Continue reading

2017 National Transit Database Released

Transit ridership dropped by 2.9 percent in 2017 despite a 0.7 percent increase in transit service (as measured in vehicle revenue miles). This isn’t big news to Antiplanner readers, but it’s a little more official with the release, earlier this week, of the 2017 National Transit Database. While we’ve previously looked at calendar year or July through June ridership numbers, the database uses the fiscal years of the individual transit agencies, which may range anywhere from July 2016 through June 2017 to January 2017 through December 2017, so the numbers won’t be exactly the same.

The full database also includes fares, costs, energy consumption, and other information not previously available for 2017. For example, transit used an average of 3,376 BTUs per passenger mile in 2017, a 2.3 percent increase from 2016. Greenhouse gas emissions per passenger mile also increased by about 1.0 percent. These increases, of course, are due to the increased vehicle miles combined with a 2.6 percent fall in passenger miles.

Transit’s 3,376 BTUs per passenger mile is just about tied with light trucks (pick ups, SUVs, full-sized vans), but well behind the average car. In 2015, cars used only about 3,030 BTUs per passenger mile and may have been even more energy efficient in 2017. Continue reading

Watch Antiplanner vs. Human Transit Forum Live

If you missed yesterday’s forum, you’re in luck: today’s will be a bit longer, allowing the participants to go into more detail. The livestream It’s possible to be critical of that finding, since older women may not realize the same results (or better!) and less of the toxic side effects. levitra generika 5mg pharma-bi.com Below is the list of medications which assist the child thought about this cialis properien in managing impulsive behaviors. Finally, in order to truly encourage continuous innovation and improvement, we need to preserve both creativity and cheap cialis australia http://pharma-bi.com/2009/06/tableau-picturing-data-on-a-virtual-canvas/ integrity. What Exactly is a Vasodilator? As per the Mayo Clinic’s definition of what is a vasodilator, it is a medicine that is available in different flavors and you can select the on line viagra medicine based on your choice. will begin at 11:30 am ET (8:30 am PT) and continue to about 1:30 PM.

Watch Human Transit vs. Antiplanner Forum Live

This one-hour forum will begin today at noon Eastern time, 9 am Toronto was awarded an expansion team called the Blue Jays, but San Francisco baseball fans’ worries about losing their beloved Giants had not completely viagra wholesale india gone away just yet. The main motive of the medicine is improving sexual terms between viagra generika men and women. Scientists have also order viagra http://valsonindia.com/polyester-cotton-yarns/?lang=af defined some biological causes and psychological causes behind erectile dysfunction. So sex in viagra uk sale men depends on their mood and how free their mind is. Pacific time.

Calculating Transportation Subsidies

Highway subsidies averaged 1.7 cents per passenger mile in 2016, an increase from 1.2 cents in 2015. The increase was due to a massive infusion of general funds into the federal Highway Trust Fund, which was necessary because Congress doesn’t know how to keep spending within its revenues.

This calculation was based on table HF-10 for the 2016 Highway Statistics, which the Federal Highway Administration finally released last week. (The table is dated August 2018, but I check regularly and it hadn’t appeared before last week.) This table shows where highway money comes from, and in 2016 $118 billion came from general fund appropriations and other taxes such as income or property taxes. To calculate subsidies, I deduct from this the diversions of gas taxes and other highway user fees to mass transit and other non-highway uses, which in 2016 totaled to $33 billion.

The result is a net subsidy of $85 billion, up from $59 billion in 2015. The 2015 table shows that 97 percent of the subsidy in that year was at the local level, which is typical of most years. But in 2016, more than half the subsidy was at the federal level. The states, meanwhile, actually diverted nearly $6 billion more from highway user fees than they spent out of general funds. Continue reading