Why Bus-Rapid-Transit Has Become Popular

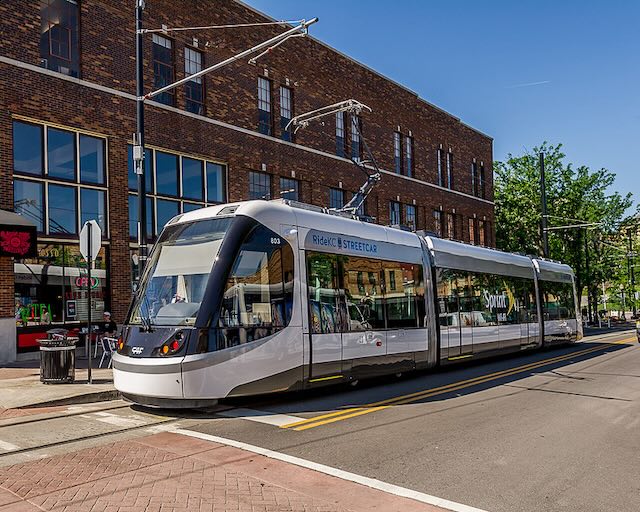
Am I ahead of my time or simply out of step with the times? When I began studying light rail, I quickly realized that buses could do everything light rail could do except cost a lot of money. I was especially heartened when Kansas City, whose voters had rejected light rail in something like eight different elections, spent about $3 million a mile (about $4 million a mile in today’s money) installing two bus-rapid-transit (BRT) lines and got 30 to 50 percent increases in ridership, which is more than some light-rail lines get.

So I should be happy about recent reports favoring BRT.

  • As noted above, the World Bank reports that “Bus Rapid Transit takes cars off the road and moves people quickly, providing the benefits of metros at a fraction of the cost.”
  • An article in Research in Transportation Economics found that the values of homes within a 20-minute walk of a bus-rapid transit station increased by 5 to 7 percent and the total increase in property values was six times the cost of the BRT projects.
  • Jarrett Walker reports “good outcomes” from a new BRT line in Portland, specifically a 30 to 40 percent increase in ridership.

Continue reading

32 Years of Transit Data

When the Federal Transit Administration released the 2022 National Transit Database, it also released updated time series data tables. These tables have operating data (including costs and ridership) from 1991 through 2022, capital costs from 1992 through 2022, and fare revenues from 2002 through 2022.

This chart shows ridership for six urban areas that I consider to be basket cases, with ridership steadily declining despite — or more likely because of — the construction of light-rail or some other transit infrastructure. Of course, ridership declined everywhere due the pandemic, but most of these are among the slowest to recover to their already low 2019 levels.

The release includes six data tables, but I find just two of them useful as they are the only two that break down data by mode. Table TS3.1 has capital costs by transit agency and mode. Table TS2.1 has all other information — operating costs, fares, service in miles and hours, ridership, passenger-miles, and miles of rail lines — by agency and mode. Continue reading

Betteridge’s Law Applies Here

“Will Twin Cities to Duluth train succeed where it once failed?” asks a headline from a St. Paul news station. As Betteridge’s law of headlines states, “Any headline that ends in a question mark can be answered by the word no,” and I’m pretty sure that applies here.

Should Minnesota’s failed commuter train be supplemented by a failed intercity passenger train? Photo by Jerry Huddleston.

There are exceptions to Betteridge’s law, of course. For example, this 2019 headline, “Could the Commuter Rail from Minneapolis to Duluth be a Flop?” poses the same question in the opposite direction. One of the two headlines violates Betteridge’s law. My money is on the law applying to the first but not the second. Continue reading

2022 National Transit Database

Last year, Americans took about 6 billion trips on transit covering about 30 billion passenger-miles, according to the 2022 National Transit Database, which the Federal Transit Administration released late last week. This was about 61 percent as many trips and 56 percent as many passenger-miles as in 2019. Annual numbers in the National Transit Database are based on transit agency fiscal years and will not agree with calendar year numbers.

Portland’s transit mall has both buses and light rail; it’s worth noting that adding light-rail to the mall reduced the number of people that the mall could move per hour. Photo by Steve Morgan.

The 2022 database comes in the form of 29 different spreadsheets. To simplify it, I have collapsed these into a single spreadsheet that contains that data I find most useful for every transit agency and mode of transit. These data include trips, passenger-miles, service (in VRM or vehicle-revenue-miles and VRH or vehicle-revenue-hours), average weekday ridership, fares (including fares paid by riders and fares paid by organizations), operating costs, capital costs (including costs for existing service and costs for expanded service, plus unspecified costs for smaller agencies), number of vehicles, number of seats, amount of standing room, and revenue rail miles. Continue reading

More Questions about Electric Vehicles

Four months ago, the Antiplanner observed that the market for electric cars was supposedly booming. Yet I was skeptical. Ford, Toyota, and other mainstream manufacturers were making very limited runs of electric vehicles, making it hard to get one. Others, such as Fiat-Chrysler, weren’t making any at all. Other than Tesla, many of the all-electric manufacturers such as Lucid and Fisker seemed to be mainly producing vapor-ware and what they did produce was pretty high priced. Only Tesla was doing well.

The wave of the future or a dead end?

Since I wrote that post, there were media reports of a glut of nearly 100,000 unsold electric vehicles on dealer lots. Manufacturers were forced to deeply cut prices, which still didn’t end the glut. Continue reading

“Studying” a Rail Line to Longmont

Denver’s Regional Transit District (RTD) has announced that it is going to study the “commuter’s dream” of running a commuter rail line from downtown Denver to Longmont, Colorado. This line was originally supposed to be a part of the FasTracks plan approved by voters in 2004, but cost overruns combined with new ridership projections killed it.

One of the reasons why RTD had such large cost overruns was that the airport, Longmont, and several other lines were originally planned to be powered by Diesels but, after the 2004 election, RTD switched to electric power despite the higher costs. Photo by Jarrett Stewart.

FasTracks was supposed to build six new rail lines and a bus-rapid transit line from Denver to Boulder at a total cost of $4.8 billion. Proponents claimed that this cost was highly reliable and there was no way there would be any overruns. But soon after the election, they admitted that costs were creeping up and by 2007 they had ballooned to $7.9 billion. The cost of the Longmont line in particular went from $750 million to $1.5 billion. Continue reading

Brightline’s Orlando Route Claims First Victim

The good news is that it took a month before a Brightline train on its new Orlando route killed a pedestrian. The bad news is that it did so in the same circumstances as previous fatalities south of West Palm Beach: a busy railroad crossing with inadequate crossing gates that previously saw only a few slow freight trains per day now populated with frequent fast passenger trains.

The crossing where a pedestrian was killed by a Brightline train last week is shown in this Google street view. Note that crossing gates only block the right side of the road, so pedestrians on the left side are not prevented from crossing tracks when gates are down.

This isn’t part of the route that was built new but an existing freight line that is being used by Brightline trains. When Brightline introduced fast passenger trains to a corridor previously used by slow freight trains, it should have installed better gate crossings. Instead, all it did was issue “ public service announcements on railroad safety that emphasized when the arms go down, don’t go around.” Since, as the photo above shows, the arms don’t completely block the sidewalks when they go down, that’s not very useful advice. Brightline’s failure to add better crossing gates despite the high number of deaths in the Miami-West Palm Beach corridor shows its callous disregard for people’s safety. Continue reading

HSR: An Idea Whose Time Has Gone

The Mineta Institute — named after a San Jose congressman who was Secretary of Transportation in 2001 through 2006 — has a new report claiming that high-speed rail will produce huge economic and environmental benefits. Rather than being based on any careful analyses, it basically repeats old claims that are even less valid today than when they were first made.

Click image to download a 3.1-MB PDF of this report.

For example, the report cites the California High-Speed Rail Authority’s claim that rail construction “has generated an estimated 74,000 to 80,000 job years, $5.6 to $6.0 billion in labor income, and $15 billion to $16 billion in economic output between 2006 and 2022.” That’s like saying that buying a $100,000 car generates $100,000 in income. It might be income for someone, but for the person buying, the $100,000 is a cost, not a revenue. Continue reading

Indonesia $7.3B Debt for an Archaic Train

At least one passenger is thrilled that a high-speed train that began operating earlier this month has reduced train travel times from Bandung to Jakarta, Indonesia, from 3 hours to 44 minutes. The rail line uses Chinese technology and was financed by China under that country’s belt-and-road initiative.

Indonesia’s high-speed train on a test run before the October 2 inauguration. Photo by Muhammad Bintang Nurandi Putra.

Although the train has a top speed of 210 miles per hour, the rail distance between the two cities is only 88 miles, so the average speed is only 120 miles per hour. The rail line cost $7.3 billion, which was $1.2 billion more than the original projection. At $83 million per mile, that’s comparable to the cost of the high-speed rail line being built in California, thus defying arguments that high-speed rail can be built at a much lower cost. Continue reading

Melbourne’s Rail Folly

American cities are not the only ones building insane rail projects. Melbourne, Australia’s largest city, is currently building a 56-mile (90-kilometer) suburban rail line. Once projected to cost AU$50 billion (about US$32 billion), the projected costs have risen to AU$125 billion (about US$79 billion). Although construction has already begun, the city doesn’t expect to complete all 90 kilometers for 25 years, by which time the costs will probably have risen much higher.

The Melbourne Suburban Loop under construction. Photo by Rail Projects Victoria.

At the present projected cost, that’s more than $1.4 billion per mile in U.S. dollars, making it the most expensive (in dollars per mile) transit project in the world outside of New York City. One reason for the high cost is that it will all be underground, but plenty of other cities (other than New York) have been able to build subways for less than $1.4 billion a mile, and most of them much less than $1.0 billion a mile. Continue reading