
Compared with 2019, the Southeastern Pennsylvania Transportation Authority (SEPTA) is carrying 30 percent fewer riders and collecting 13 percent less revenue per rider. Yet it is spending 10 percent more on operations despite having cut service by 10 percent. It previously filled this funding gap with federal COVID relief funds, but now those have run out. In order to continue operating as if there had been no ridership decline, SEPTA has demanded that the state legislature supplement its existing funding — $1.5 billion per year — with an additional $300 million in F.Y. 2026.
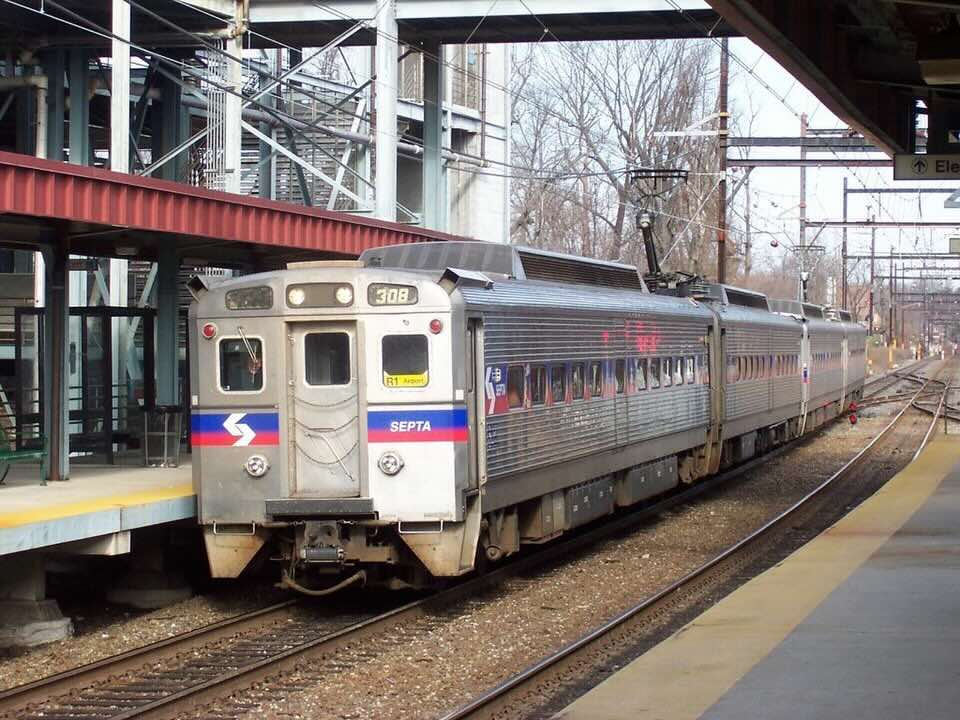
SEPTA Silverliner train. Photo by Adam E. Moreira.
The legislature failed to comply, so SEPTA has petulantly adopted a budget that makes what it calls “devastating service cuts & fare increases.” “This budget will effectively dismantle SEPTA — leaving the City and region without the frequent, reliable transit service that has been an engine of economic growth, mobility, and opportunity,” says an agency press release. “Once this dismantlement begins, it will be almost impossible to reverse, and the economic and social impacts will be immediate and long-lasting for all Pennsylvanians — whether they ride SEPTA or not.” Continue reading


