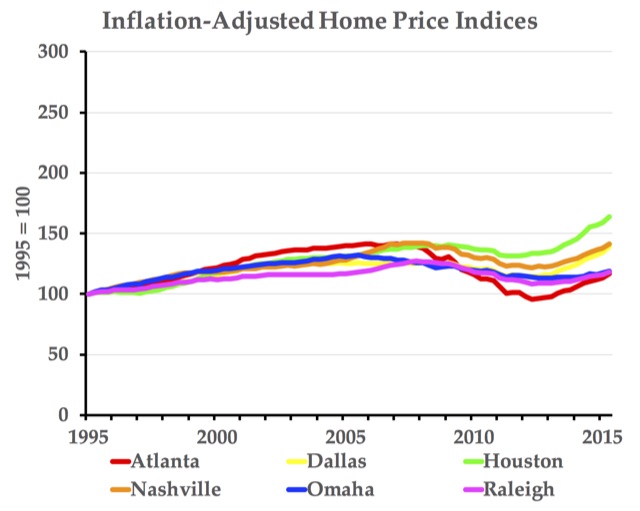
After the Antiplanner posted recent housing data on Wednesday, a reader asked for home price trends. These data are available for states and metropolitan areas from the Federal Housing Finance Agency. For some purposes, I prefer urbanized areas instead of metropolitan areas, for numbers like these the differences will be small.

Naturally, the FHFA’s raw data are not easy to visualize, so I’ve supplemented the agency’s metropolitan area data with a spreadsheet that automatically makes charts showing price indices in up to six urban areas. For example, the above chart shows indices for six areas with minimal land-use regulation.


