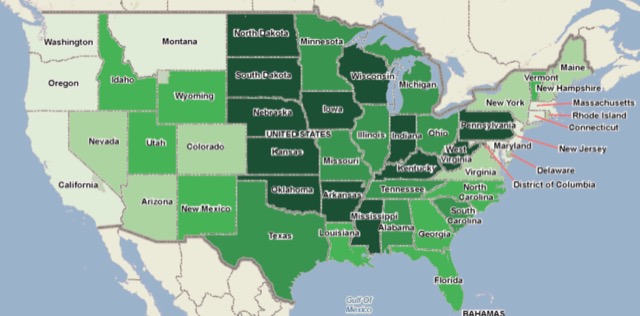
For those who like to look at maps rather than databases, the Lincoln Institute has released a handy new tool mapping the United States using all sorts of criteria. Among other things, the map can show every structurally deficient and functionally obsolete bridge, housing affordability, homeownership rates, conservation easements, and many other land-use and transportation factors.

The above map, for example, shows housing affordability, with darker colors representing more affordable. Though this is at the state level, you can zoom in and see it as close as the census tract level.


