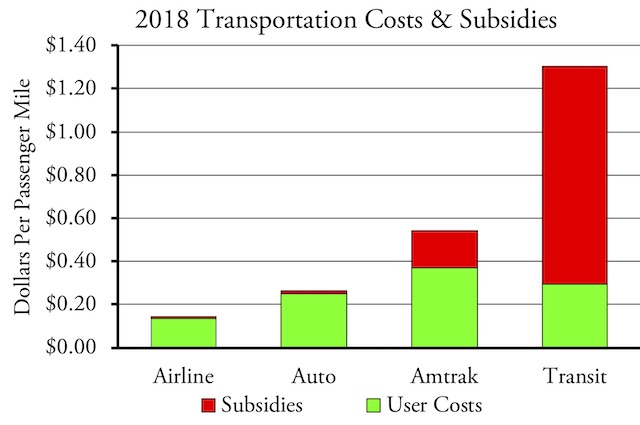
Last year, I published a policy brief that calculated 2017 transportation subsidies and costs for airlines, Amtrak, highways, and transit. When 2018 data for Amtrak, highways, and transit became available, I included an updated chart in a policy brief on transportation after the pandemic. But that wasn’t exactly prominent — I had a hard time finding it when someone asked me about it recently — and it didn’t have many details so I’m going to expand on it here.

The above chart is useful because it shows the disparities. Amtrak spends almost four times as much to move someone a passenger mile as the airlines. Transit agencies spend almost five times as much to move someone a passenger mile as personal automobiles. Continue reading


