
Kansas City is one of the few urban areas to see ridership recover from the pandemic. Recent transit data shows that the region’s transit carried 99 percent as many riders in the first half of 2024 as the same months in 2019, albeit mainly because it has reduced fares to zero. However, all is not well with transit in the self-described Paris of the Plains.
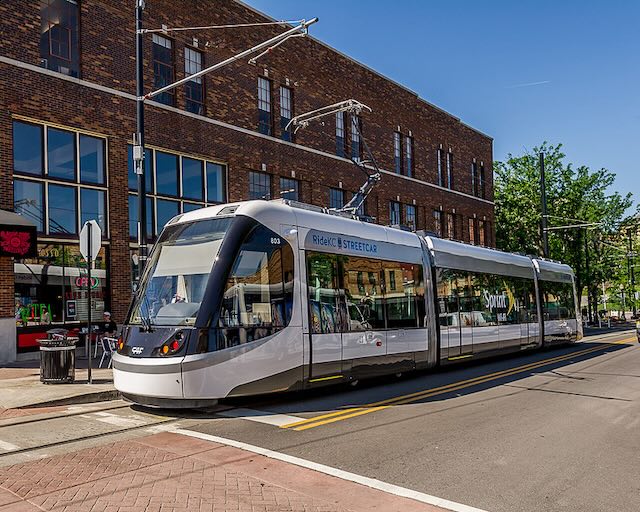
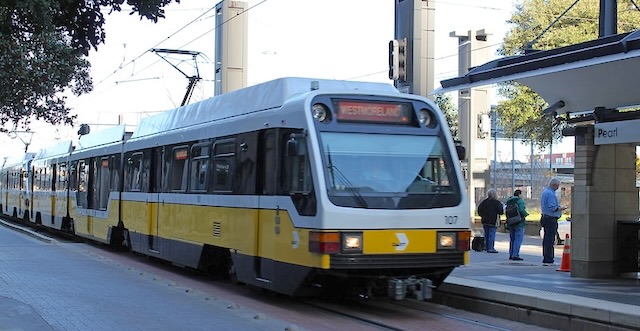
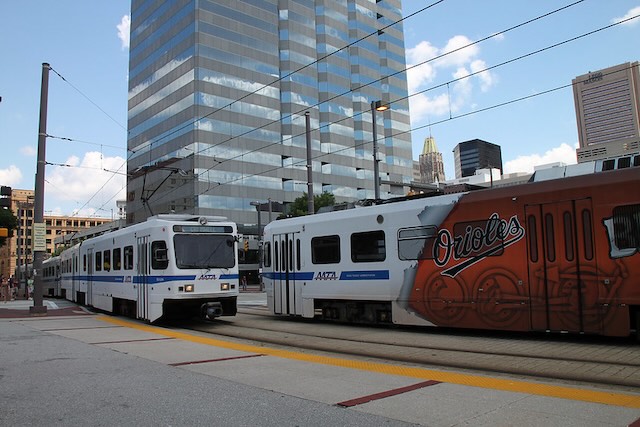
The Kansas City streetcar is a great success if you ignore the fact that it has never earned a single penny in fare revenues. Similarly, KC’s bus system’s recovery from the pandemic is less impressive considering it isn’t earning any fares either. Photo by Jazz Guy.
Earlier this week, the Blue Springs city council voted to end support to the Kansas City Area Transportation Authority (KCATA). The suburb of about 58,000 residents had paid the transit agency $73,000 for transit services in 2022-2023, but the agency had increased its requirement to nearly $123,000 for 2024-2025 “without much justification for the increase,” the city said. Continue reading


