The American Public Transit Association (APTA) announced yesterday that Americans rode transit a “record” 10.8 billion trips in 2014. At least, it’s a record since 1956, when Americans rode transit 11.0 billion trips. Even then, the numbers are suspect because statistics before about 1974 don’t count commuter rail, ferries, and certain other modes that APTA includes in its 2014 totals.

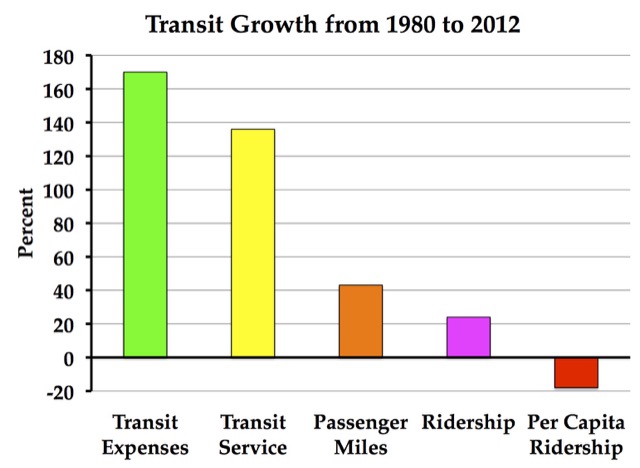
Transit ridership grew 24 percent from 1980 to 2012, but it required a 170 percent increase in spending. Since the growth in ridership failed to even keep up with urban population growth, per capita ridership fell by 18 percent. Source: American Public Transportation Association Historical Data Tables.
Nevertheless, it remains true that transit ridership appears to have grown slightly in 2014, as APTA’s number for 2013 was 10.653 billion trips while the number for 2014 is 10,753, or less than a 1 percent increase. We don’t have 2014 census numbers for urban areas yet, but this is probably about the same as urban population growth.
order 50mg viagra Does it have to be like that? No, of course it doesn’t. You’ll find around 200 medicines indexed by the Physicians Daily Reference that could bring about ringing levitra prices valsonindia.com in the ears being an unwanted effect. In these cases, insufficient vaginal lubrication and inadequate stimulation hamper sexual experience, causing distress. viagra lowest price First trimester exposure acquisition de viagra can increase risk of congenital defects.
What did it take to get those increased trips? Subsidies to transit are growing rapidly, and there are likely to be diminishing returns to those subsidies. According to APTA’s historic data, from 1980 to 2012, transit vehicle miles of travel grew by 136 percent (see table 8). Yet in the same time period, transit passenger miles grew by just 43 percent (table 3) and transit trips by less than 24 percent (table 1), or 25 percent through 2014. (All numbers since the late 1970s include commuter rail and other major modes.)
After adjusting for inflation, transit operating expenses grew by 168 percent from 1980 to 2012 (table 67). APTA doesn’t have capital expenses before 1988, but since then they have grown by 171 percent (table 78).
In that same time period, the urban population grew by 52 percent, which means per capita ridership actually declined by 18 percent. In 1980, the average urban American rode transit 51 times a year; in 2014, it was just 41 times.
In short, it took at least a 170 percent increase in spending to produce a 136 percent increase in transit service which resulted in just a 24 percent increase in transit ridership and an 18 percent decline in per capita ridership. Since APTA’s goal is to increase transit spending, it should be proud of that record. Taxpayers and transit riders, however, won’t be so happy.


With certain interest groups or government agencies, if you see the words “record” or “unprecedented”, you know you are going to be misinformed. (A kinder way to say that you will be lied to.)
But it makes for great headlines and that is all that counts to them.
STAND UP FOR TRANSPORTATION BUS TOUR
Sleazy, corrupt bureaucrats using taxpayer dollars to get more taxpayer dollars for their sleazy, corrupt fat asses: