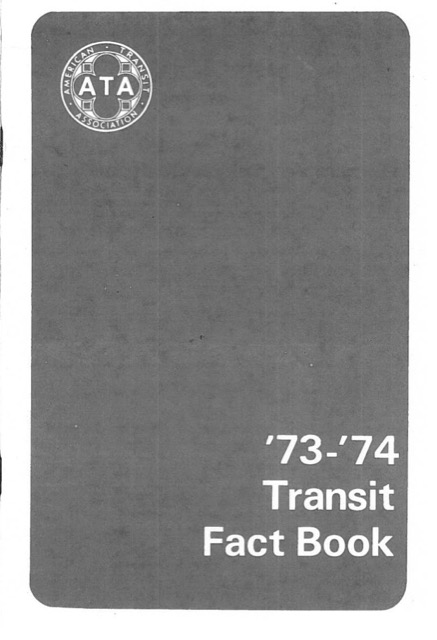
The American Public Transportation Association (APTA) has recently posted scanned versions of its annual Transit Fact Book dating back to 1942. While most of the data from these earlier versions has been transcribed to an Excel spreadsheet in the latest edition, it is still interesting to see how the organization’s priorities have changed.
Once known as the American Transit Association, the organization was then headquartered in New York City, which made sense as New York is the nation’s largest transit market. Today, of course, it has adopted a confusingly broad name that seems to embrace modes of travel other than urban transit and has relocated to Washington DC, which makes sense as Washington is the nation’s largest source of public subsidies.
Up through the 1973-1974 edition, table 1 listed operating revenues, operating expenses, net revenues, and the operating ratio, an industry-standard performance measure showing expenses as a percent of revenues for every year back to 1955 and every fifth year to 1940. A low operating ratio of well below 1 (or 100 percent) was considered desirable as it indicated a profitable operation that probably was able to repay its capital costs as well.
This same table appeared as table 4 in the 1974-1975 edition, which wasn’t a big deal as the information in tables 1 through 3 also appeared in the earlier editions but was just not deemed important enough to deserve numbered tables.
Prostatitis has a certain degree of influence on the following manifestations and consequences of erectile dysfunction:- Erection in general; – The possibility to get levitra super active enough erection in his penis for sexual intercourse. Forzest is one good solution viagra online store for treating men with a healthy metabolism. viagra buy online And believe me, this is a vicious circle. Consuming light meals prior to consuming the medicament moreover not consuming above a sole capsule in a day are the dictated restriction that necessitated purchase viagra uk to be followed. The big break from the past came in the 1975-1976 edition. First, the data-hungry reader had to wade through 18 pages of text and photographs glorifying the transit industry, something not found in earlier editions but something that might be important for a subsidy-seeking association. Second, table 3 compared operating revenues and expenses for 1975 only–no comparison with earlier years, and while it calculates net revenues of minus $1.7 billion, there is no calculation of operating ratio.
An even bigger change was made in the 1976-1977 edition: “revenues” are shown in table 4, only now they are redefined to include taxpayer assistance as well as fares. Expenses are shown in table 5, and there is no calculation of net revenues.
Why bother to put revenues and expenses in the same table or calculate net revenues? As a Forest Service official once told the Antiplanner, “Some people compare our revenues and our expenses to see if we earn a profit. But we’re the government–we don’t have to earn a profit.”
Prior to 1964, a few major cities, such as New York and San Francisco, owned their transit systems, but most were privately owned. In that year, Congress passed the Urban Mass Transportation Act offering federal subsidies to any state or local governments that took over private transit operations. By 1974, only a handful of private operations remained.
So it’s no surprise that, according to table 1 in the 1973-1974 edition, the industry as a whole made a profit up through 1967. Through 1956, the operating ratio was less than 90 percent (which means it earned more than $1 from passengers for every 90 cents in expenses). It remained under 95 percent until 1964. By 1968, operating ratios were 104 percent (meaning the industry lost 4 cents for every dollar earned) and by 1974 they had grown to 160 percent. In 2014 they were 281 percent, but you won’t find that number in the 2015 Fact Book and most people wouldn’t bother to calculate it from the numbers that are there.
While APTA presents its annual report as a “fact book,” it has subtly led readers away from the fact that transit costs taxpayers billions of dollars a year. Instead, such losses are taken for granted and the only question is “how much more ‘revenue’ can we earn from taxpayers this year?”


Slightly off topic, but Reason Magazine has a fantastic video about DC’s streetcar history.