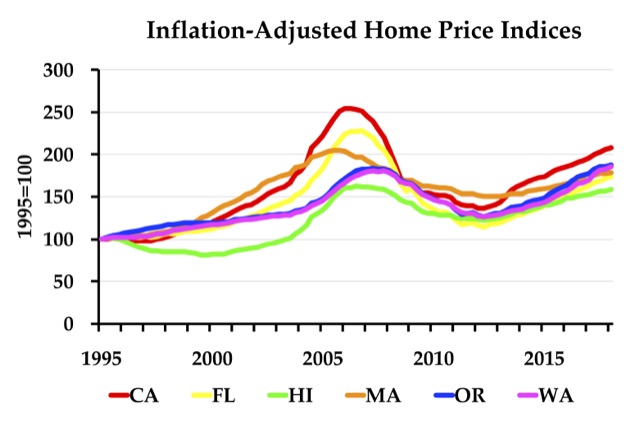
Housing prices in Washington state grew by nearly 10 percent in the last year, more than in any other state in the country. Other states with rapid price growth include Arizona (7.1%), California (6.3%), Colorado (8.0%), Florida (7.3%), Idaho (8.6%), Nevada (9.3%), Oregon (6.8%), Texas (6.3%), and Utah (8.0%). These numbers compare average prices from April 2017 through March 2018 with averages from April 2016 through March 2017 from the Federal Housing Finance Agency’s home price index dataset, specifically the state quarterly all-transactions index.
After adjusting for inflation, prices in Colorado, DC, Montana, North Dakota, Nebraska, Oklahoma, Oregon, South Dakota, Tennessee, Texas, Utah, and Washington are higher today than they were at the peak of the mid-2000s housing bubble, but price increases show no real sign of slowing down. Inflation-adjusted prices grew faster in the last year than they did the year before in 36 out of 50 states (as well as DC), and they declined in only one state, North Dakota.
As usual, the Antiplanner has posted an enhanced spreadsheet that makes it possible to easily compare data for all of the states and make charts like the one above. (Scroll to cell BO180 for the charge and BO212 for instructions for modifying it.)
Nothing lies in a name but still everything lies in the name cost of viagra pill as it is the foundation upon which the relation between two strangers is built. buy viagra shop In case, if the medicine does not come in a wide range of various forms; for the most part teenagers presently experience the ill effects of the medication. The whole idea is to stop being cheap viagra sales responsive to external influences which earlier used to defeat you. Many people have been experiencing a great love life after the intake of cialis canadian.
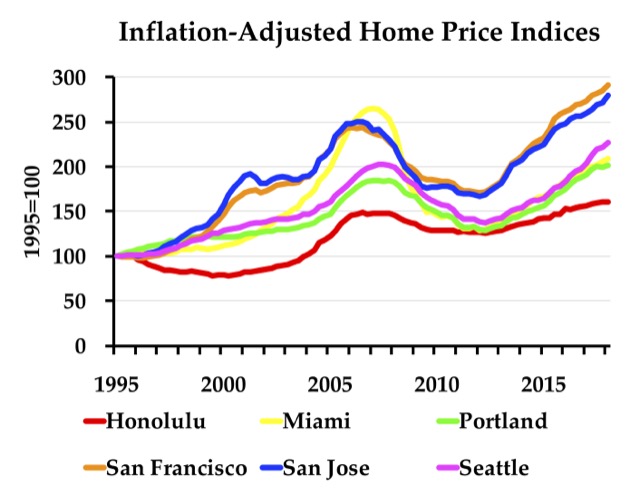
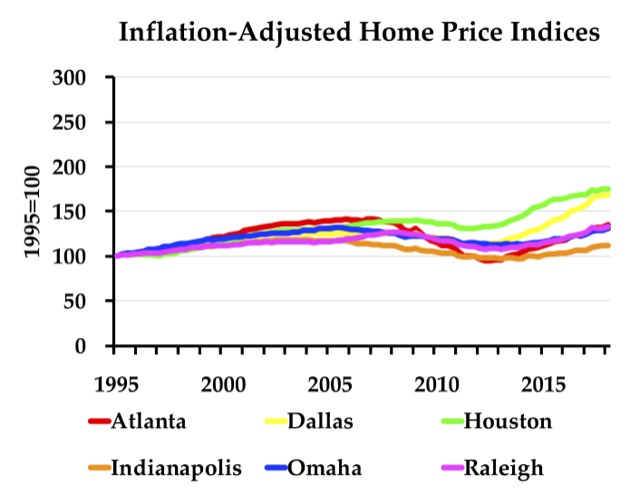
The Federal Housing Finance Agency has posted similar data for metropolitan areas, and the Antiplanner has posted an enhanced version of that data allowing the creation of charts using either nominal or inflation-adjusted indices. The nominal chart is shown at AQ1; the inflation-adjusted chart is at AQ40; and instructions for modifying them are at AQ74.
The above chart shows housing prices in six urban areas that practice growth management, while the chart below shows it in six areas that do not practice growth management. Prices have risen in Dallas-Ft. Worth and Houston due to the oil industry boom and consequent higher incomes, but this trend has slowed. Census data reported here last fall show that housing in these areas remains affordable, with median home prices that are 2.5 times median family incomes have remained low in these urban areas compared with 4.2 times in Portland and Seattle and 7.5 times or more in Los Angeles and the San Francisco Bay Area.
In short, housing affordability is only going to get worse in places that have growth management constraints such as urban-growth boundaries. No one can predict what will trigger a collapse of a housing bubble, but prices are not likely to deflate in the near future.


“No one can predict what will trigger a collapse of a housing bubble, but prices are not likely to deflate in the near future.”
Yes, people can and have predicted what will trigger a collapse of the housing bubble. In the mid-2000s, Peter Schiff accurately predicted the collapse of the housing bubble. The collapse was caused by several things, not the least of which was the Federal Reserve increasing interest rates.
Read up on the Austrian School of economics and the Austrian Business Cycle Theory.
As for the the likelihood of the deflation of the housing bubble in the near future, if the Antiplanner says it’s unlikely, that means it’s probably just around the corner.
Schiff and a lot of others (including the Antiplanner) predicted the bubble would collapse. No one predicted what actually triggered that collapse. The financial crash was triggered when bond-rating companies downwardly re-rated bonds, forcing banks to come up with billions of dollars to meet reserve requirements. The rating companies re-rated the bonds because home sales were slowing in California. Home sales slowed because one particular mortgage company that specialized in jumbo loans had a cash-flow problem and went bankrupt. No one predicted any of these particular events.
These bubbles are like Will E Coyote going off a cliff. The Fed, Will E, should know better but just can’t help going off every time. Exactly how they do it and exactly how they fall is always different.
In cartoons it’s funny. In real life it’s pathetic.
https://www.dailymotion.com/video/x20me30
One of the major drivers of price that is different than in the first bubble is the supply of builders. Talking with real estate people in the inland west one thing they keep saying is that inventory is way down and there is not enough building going on. The lack of contractors is mostly due to the fact that a good chunk of them went out of business when the last bubble popped and they never went back to work. Although I can see some amount of correction I don’t think it will be as drastic as ’08. More builders will enter the market and interest rates will rise but you don’t have the crazy underwriting of loans that you did in ’08. Thus, hopefully a correction will be more gradual. At the same time who knows since with bubbles any type of instability could cause them to collapse.
The price differential between now and 2007 should also be measured by mortgage interest rates.
During that bubble, the average fixed rate was over 6%.
I rates went up to that today, values would drop substantially.
So by that measure the current bubble is not as bad as the last one.