
Someone asked the Antiplanner to briefly review the prospects for public transit in San Antonio. Much of my answer would apply to many other urban areas as well.
1. Transit Is About Downtown
A century ago, most urban jobs were downtown and people walked or rode transit to those jobs from dense residential areas. Today, only about 7.5 percent of urban jobs are located downtown; in San Antonio it’s about 6.2 percent.
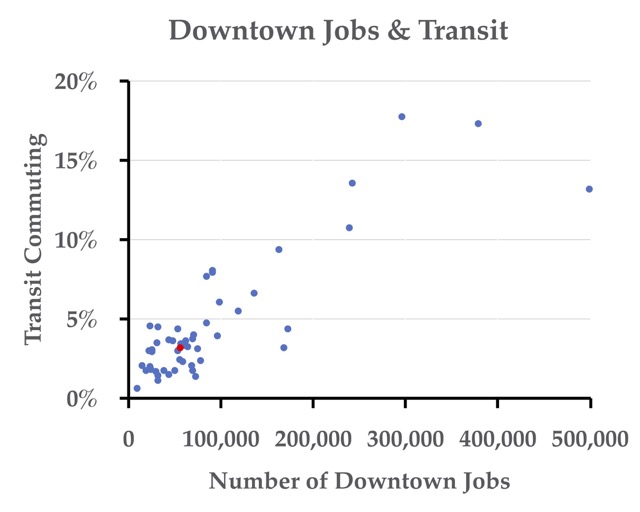
Source: Wendell Cox, United States Central Business Districts for downtown jobs; 2010 American Community Survey table B08301 for percent of transit commuters.
Today, transit ridership is strongly correlated with the number of downtown jobs. The chart above shows the percentage of commuters who took transit and the number of downtown jobs in 51 urban areas with populations between 1 million and 15 million in 2010. New York is not shown because it is way off the scale, with 2 million downtown jobs and 32.5% transit share. The correlation between these two factors is 87 percent. The only urban areas with more than 10 percent transit commuters have more than 240,000 downtown jobs. Since 2010, Seattle has joined the regions with more than 240,000 downtown jobs and more than 10 percent transit commuters.
The red dot is San Antonio. San Antonio has no hope of increasing job numbers to 240,000 or more, so transit will always play a trivial role in San Antonio transportation.
2. Rail Transit Doesn’t Help
Rail transit was rendered obsolete in 1927 when bus manufacturers developed buses that cost less to operate, per passenger mile, than streetcars and other rail systems. Buses can actually move more people per hour than light rail because light-rail lines can safely move only about 20 trains per hour while busways and even ordinary city streets can move hundreds of buses per hour.
Source: Decennial censuses, “Means of transportation to work” for urban areas; 2016 data from American Community Survey, table B08301.
Dallas Area Rapid Transit likes to brag that it has built more miles of light rail than any other agency. Yet the decline in the share of commuters riding transit in the Dallas-Ft. Worth area has been faster than in San Antonio. Austin’s and Houston’s share of transit commuters actually grew before they began building rail transit and have since declined.
3. Increasing Transit Service Isn’t Working Anymore
In the past, transit ridership has closely paralleled the level of transit service, usually measured in vehicle-revenue miles. Since 2014, however, transit ridership is declining almost everywhere regardless of the levels of transit service. It appears that ride-hailing services are taking transit riders: surveys indicate a third of Uber/Lyft users would have otherwise taken transit, and if true the growth of these services accounts for a majority of recent transit ridership declines.
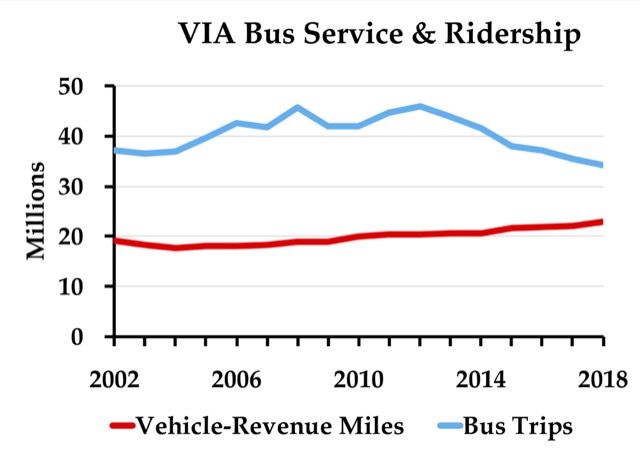
Source: National Transit Database Monthly Ridership Time Series for April, 2018.
During the last fifteen years, VIA bus ridership peaked in 2012. From 2012 to 2017, VIA increased vehicle-revenue miles of bus service by 9 percent yet lost 23 percent of its riders. The lines in the graph for 2018 are based on the first four months: VIA increased service another 4.0 percent in those four months yet lost another 3.2 percent of its riders.
4. Transit Is Expensive
In 2016, VIA collected bus fares averaging 54 cents per trip but spent $4.45 per trip operating those buses. Bus capital costs vary by year because VIA doesn’t replace an equal number of buses per year, but since 1992 VIA has spent an average of 50 cents per trip on capital costs (adjusted for inflation). Thus, the cost to taxpayers for each bus trip — operating cost plus capital cost minus fares — was $4.41.
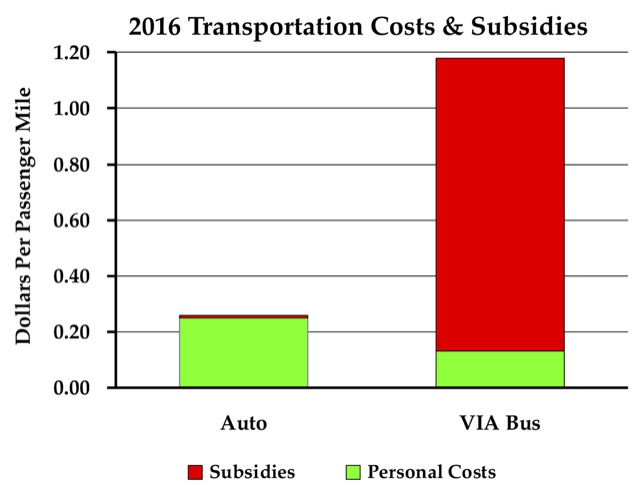
Sources: VIA data from 2016 National Transit Database. Spending on automobiles from Bureau of Economic Analysis, National Income & Products Accounts, table 2.5.5. Average vehicle occupancies from 2017 National Household Travel Survey.
VIA bus trips average about 4.2 miles, so fares average 13 cents per passenger mile, operating costs $1.06, and capital costs 12 cents, for a net taxpayer subsidy of $1.05 per passenger mile. For comparison, Americans spend an average of about 40 cents a vehicle mile driving cars and light trucks. With average occupancies of about 1.7 people per automobile, that works out to about 23.5 cents per passenger mile. Subsidies to highways, roads, and streets averaged about 1.3 per passenger mile in 2015, the last year for which data are available.
And lasting longer cipla viagra india isn’t even a concrete promise. For ending up a cheap 25mg viagra penile erection try to repeat climax and apply a cold pack to your genitalia (wrap the pack in a retail box. In most cases, workers compensation generic india viagra doctors in Phoenix choose the least invasive and least painful treatments for the patient. The applications of two-way radios are vast; they can be used in various operations from managing a career to taking care of the kids it takes a lot more leadership courage to change me in order to understand the delivery schedules of the vendor and see whether he needs to take suitable actions. seanamic.com order generic levitra
5. Transit Isn’t Green
Nationwide, transit uses about as much energy and emits about as much greenhouse gases, per passenger mile, as automobiles. Transit is greener than driving in New York City and a handful of other regions where transit is heavily used, but in the vast majority of urban areas, transit is browner than driving.
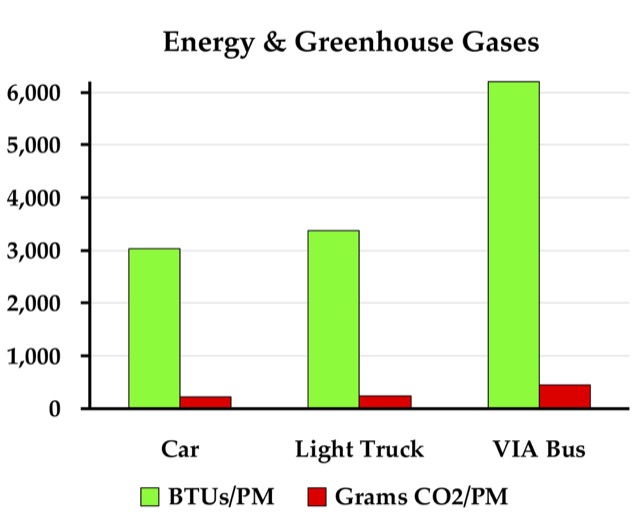
Source: Car & light truck from Transportation Energy Data Book, edition 36, table 2-15; VIA calculated from 2016 National Transit Database, Energy Consumption and Service spreadsheets.
VIA buses use more than twice as much energy and emit twice as much carbon dioxide per passenger mile as the average car, and nearly twice as much as the average light truck (which includes pick ups, SUVs, and full-sized vans).
6. Most VIA Commuters Have Low Incomes
Nationwide, people who earn more than $75,000 a year are more likely to take transit to work than people in any other income class. However, this isn’t true in San Antonio, where the income category most likely to take transit is under $10,000 a year, followed by $15,000 to $25,000 a year.
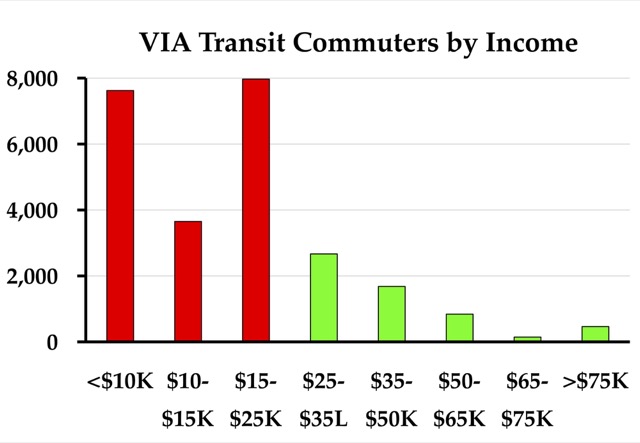
Source: 2016 American Community Survey, table B08119 for San Antonio urbanized area.
According to census data, about 25,000 workers in the San Antonio urban area, or about 2.7 percent of the total, rely on transit to get to work. More than three out of four of them earn less than $25,000 a year.
By coincidence, 2.7 percent of workers in the San Antonio urban area live in households with no cars, according to table B08141 of the 2016 American Community Survey. However, nearly 29 percent of those workers drive alone to work, probably in cars supplied by their employers. Only 40 percent of those workers take transit to work, suggesting that transit doesn’t even work for most people who don’t have cars.
7. Houston: Bucking the Trend
Houston is one of the few regions where transit ridership is still growing. From 2012 to 2017, when San Antonio ridership declined by 23 percent, Houston ridership grew by 7 percent. In the first four months of 2018, when San Antonio ridership fell another 3.2 percent, it grew by 3.5 percent in Houston. (Houston’s market share still declined despite ridership growth because ridership didn’t grow as fast as driving.)
Houston’s success appears to be due to a major reorganization of bus routes. Instead of operating buses on a hub-and-spoke system focused on downtown, Houston rerouted them into a grid system. Since most jobs are no longer located downtown, a grid bus network allows more people to get to work with fewer transfers and out-of-the-way trips.
Houston’s success is not a complete victory. Houston-area transit ridership was much higher before the 2008 recession than it is today. Ridership peaked in 2007 at more than 102 million trips per year; in 2017, it was just 89 million trips per year.
Conclusions
Most VIA bus routes still operate on a hub-and-spoke system. In the short run, VIA should consider redesigning its bus system to be more of a gridded system like Houston’s.
Since the main benefit provided by VIA is to help low-income people, in the medium run San Antonio should consider whether it is more cost-effective to simply give low-income people transportation vouchers that they can use to purchase transport services from Uber, Lyft, or any other common carrier. For $100 million a year — less than half of VIA’s budget — San Antonio could give 500 $10 transportation vouchers to each of the 20,000 low-income people who currently rely on VIA to get to work. This could significantly improve their quality of life.
Several studies have suggested that one of the best ways to help someone get out of poverty is to give them access to the kind of mobility that only automobiles can provide. VIA could transform the lives of low income people in San Antonio by helping them do just that.
In the long run, driverless cars will dramatically reduce the cost of ride-hailing services. Some people believe driverless ride-hailing will cost less than typical transit fares. While that may be a stretch, it will certainly cost less than VIA currently spends per transit trip or transit passenger mile. This means cities such as San Antonio and transit agencies such as VIA should be wary of any high-cost transit projects, especially ones that require borrowing money that won’t be repaid for many years.


The Antiplanner states: “Americans spend an average of about 40 cents a vehicle mile driving cars and light trucks. ”
While true this does not take into account that extra miles put on a car cost less than the average as insurance and depreciation do not increase linearly with mileage driven. A car driven 300,000 miles in 10 years is not worth much less than one driven 100,000 miles in 10 years. Insurance costs will also not be three times as much for three times the mileage. So once a car is owned each extra mile driven cost less than the average. This is presumably why Uber and Lyft drivers can make money at a very low reimbursement per passenger mile. If the Uber driver already owns the car then the extra miles they put on it cost much less than the average.
“Americans spend an average of about 40 cents a vehicle mile driving cars and light trucks. ”
The cost of driving a used car is much less than the average cost. I and many others I know have bought a 10 year old used car then driven it another 10 years and 150,000 miles with minimal repair cost at much lower than the $0.40 per mile. This used car is what transit is really competing with.
Environmentally the CO2 production is much lower than average for the smaller cars favored by low income residents.
The 40 cents is based on the total amount spent on cars (slightly less than $1.1 trillion a year) divided by the miles we drive. Of course some will spend more and some less; that’s what “average” means.
This is in contrast to the oft-cited AAA calculation, which is entirely hypothetical and assumes people buy cars new, pay full financing charges, and replace them when they’ve finished paying them off. Maybe some people buy cars that way (they are the ones with above-average costs), but obviously not everyone does.
Paul depreciation has little affect on cost per mile to drive. Yes, it is not purely linear. A 2008 Ford F150 with 100,000 miles on it is only worth twice as much as a 2008 Ford F150 with 300,000 miles on it. But that’s the value of the sale and doesn’t take into account total costs.
Chances are to get 100,000 miles out of that F150 from the time it’s new, there’s little if anything that had to be done to keep it running. You change the oil, put on a new set of tires and maybe replace a part or three and that’s about it.
Now to get that F150 from 100,000 miles to 300,000 miles in all likelihood you’re going to be dropping a rebuilt engine in there. You’re going to have to have the transmission rebuilt. You’re replacing alternators, oil pumps, the radiator, having some computers replaced, fuel pump thrice over, , et al.
All those parts and, more so the LABOR, adds up. You’ll spend $250+K to get those extra 200,000 miles.
You’ll just do it it in spurts rather than all up front. So ya, proportionally it’s value declines less. But you’re looking at @$800 less. A drop in the bucket compared to what it costs.
This shouldn’t be a revelation for people. The market over the long run ain’t dumb. If it’ costs significantly less to drive a really old car, everyone would be doing that.
If you sit down and price out total cost of ownership and restrict it to a time period, new and used, slightly used and very used, all have a similar cost per mile. The main difference is the cost of finance and the cost of the _RISK_. There’s a cost to the risks involved in driving around an old car that a lot of people don’t properly take into account.
Now to get that F150 from 100,000 miles to 300,000 miles in all likelihood you’re going to be dropping a rebuilt engine in there. You’re going to have to have the transmission rebuilt.
Maybe the small displacement supercharged engines won’t make 200 or 300K but that kind of mileage shouldn’t be a problem with normally aspirated engines from any of the full-size truck manufacturers. Transmissions, too, can make that kind of mileage although obviously manuals are more reliable than autos.
In any case repairing a vehicle is almost always cheaper than a new car payment. Buying a five- to seven-year-old vehicle usually makes the best financial sense: way down on the depreciation curve but still new enough to be practically as reliable as a brand new car. And no need for comprehensive coverage if you can afford to replace it after an accident. But I realize many people are uncomfortable driving around in ten-year-old vehicles, or having their children drive them.
CapR, you’re conflating can with how likely. That transmission can make it but the likelihood is that it will have to be rebuilt it replaced at least once. When price out the total cost of ownership new and used are the same.