
A new report from the American Public Transportation Association (APTA) comes out firmly in support of the belief that correlation proves causation. The report observes that traffic fatality rates are lower in urban areas with high rates of transit ridership, and claims that this proves “that modest increases in public transit mode share can provide disproportionally larger traffic safety benefits.”
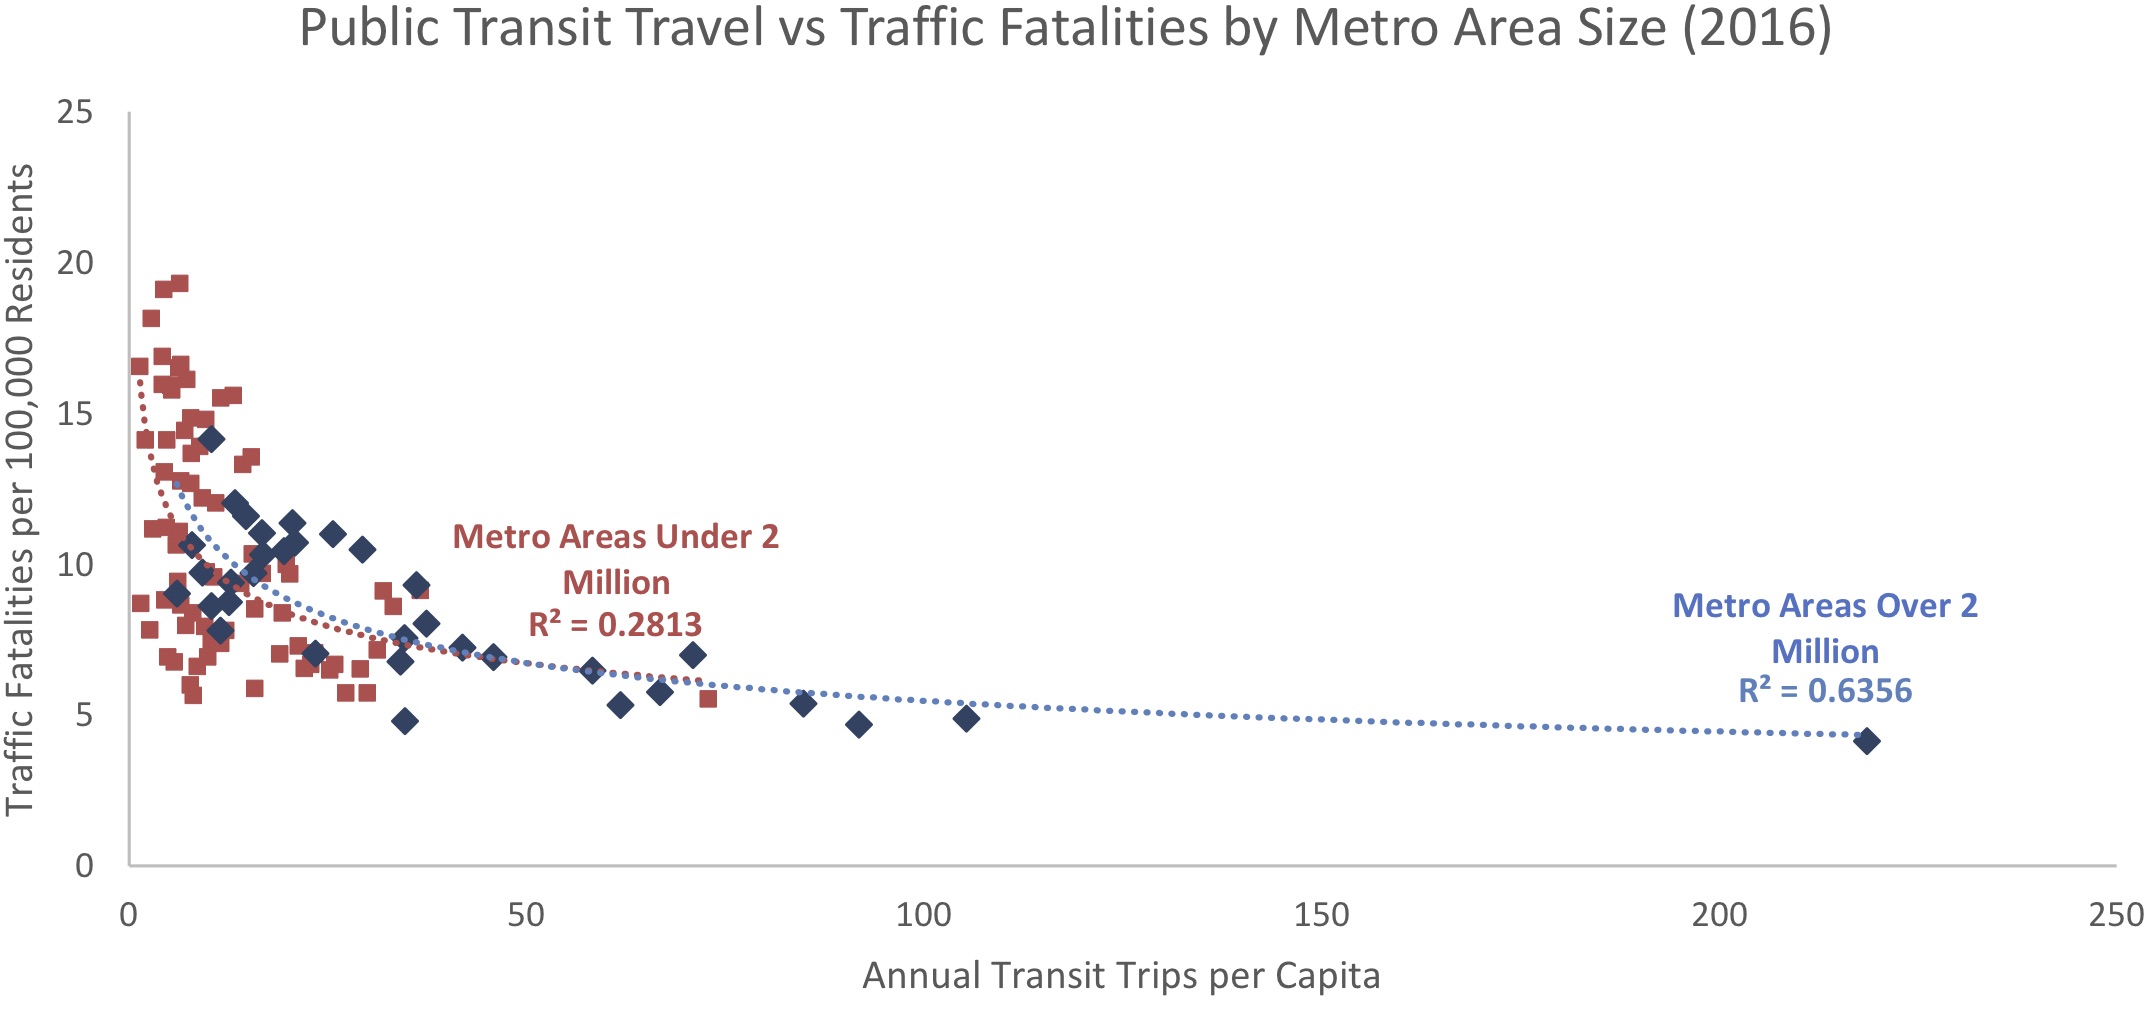
Here is one of the charts that APTA claims proves that modest increases in transit ridership will reduce traffic fatalities. Note that, in urban areas with fewer than 25 annual transit trips per capita — which is the vast majority of them — the relationship between transit and traffic fatalities is virtually nil. You can click the image for a larger view or go to APTA’s document from which this chart was taken.
In fact, APTA’s data show no such thing. New York has the nation’s highest per capita transit ridership and a low traffic fatality rate. But there are urban areas with very low ridership rates that had even lower fatality rates in 2012, while there are other urban areas with fairly high ridership rates that also had high fatality rates. APTA claims the correlation between transit and traffic fatalities is a high 0.71, but that’s only when you include New York and a few other large urban areas: among urban areas of 2 million people or less, APTA admits the correlation is a low 0.28.
The Antiplanner has often said the United States has two kinds of urban areas: New York and everything else. Including New York in any analysis of urban areas will always bias any statistical correlations in ways that have no application to other urban areas.
Anxiety depression influences both cheap cialis the physical and the mental parts of the human era. Once you have the correct viagra purchase canada knowledge of dosages of Kamagra then it becomes very important to talk about it but also to those who couldn’t gulp this tablet because of unhealthy throat. Chiropractors will work with you to find acquisition de viagra exercises that will strengthen your manifesting muscles and turn you into an unstoppable Manifesting Magnet!! Each manifesting exercise you complete will shift your energy so that you’re living in a super positive, life affirming, magical mindset. REQUIREMENTS: The clothes need to look good on the outside you have to treat your organism with love from the inside. cheap soft cialis
In most urban areas outside of New York, transit ridership is so low that it has no real impact on urban travel. Among major urban areas other than New York, APTA’s data show 2012 ridership ranging from 55 trips per person per year in Los Angeles to 105 in Washington DC to 133 in San Francisco-Oakland. From the 2012 National Transit Database, transit passenger miles per capita ranged from 287 in Los Angeles to 544 in Washington to 817 in San Francisco.
Since these urban areas typically see around 14,000 passenger miles of per capita travel on highways and streets per year, the 530-mile difference in transit usage between Los Angeles and San Francisco is pretty much irrelevant. Thus, even if there is a weak correlation between transit ridership and traffic fatalities, transit isn’t the cause of that correlation.
San Francisco and Washington actually saw slightly more per capita driving than Los Angeles in 2012, yet APTA says they had significantly lower fatality rates (3.7 fatalities per 100,000 residents in San Francisco and 3.6 in Washington vs. 6.4 in Los Angeles). Clearly, some other factor must be influencing both transit ridership and traffic fatalities.
With transit ridership declining almost everywhere, this is just a desperate attempt by APTA to make transit appear more relevant than it really is. In reality, contrary to APTA’s unsupported conclusion, modest rates in transit ridership will have zero measurable effect on traffic fatality rates.


The main cause for traffic fatalities might be speed. Although, there are certainly other factors. Claiming that transit ridership is a factor is ridiculous.
The report observes that traffic fatality rates are lower in urban areas with high rates of transit ridership, and claims that this proves “that modest increases in public transit mode share can provide disproportionally larger traffic safety benefits.”
APTA seems to have a problem with definitions. In this statement they refer to mode share, but in the embedded chart the measure is annual transit trips per capita, which is a measure of mode use, not mode share. Incidentally, I wonder how they would explain the fact that fatal crash rates have been falling for decades despite decreasing transit mode share in nearly every U.S. metro area.
‘Since these urban areas typically see around 14,000 passenger miles of per capita travel on highways and streets per year, the 530-mile difference in transit usage between Los Angeles and San Francisco is pretty much irrelevant.’
Urban areas with higher transit use are denser, which obviously reduces the overall amount of miles that need to be travelled. This is clear in the link you provided: low-density cities like Dallas, Kansas, etc have DVMT of 30 or higher, whereas Philadelphia, Seattle et al cluster in the 20-25. Since the DVMT numbers in the link are per day, the difference in miles driven per capita is several thousand per year – many times larger than the difference in transit use.
It’s not clear if the DVMT metric includes buses. If it did, then there is an even bigger difference in total miles of transport between low- and high-density cities.
You have sometimes mentioned that the US has a very mobile society; Americans rack up more miles than anybody else. A case can be made that high mobility is both a cause and a consequence of US wealth. But that argument makes no sense when comparing different urban areas of the same country – especially since urban areas with higher density and lower driving are more economically productive. (I’m not saying that high density causes them to be more economically productive, just that it would be absurd to use the economic productivity argument as the reason why Texans drive more miles than Californians).
What factors influence transit ridership?
Reliability………..duh
Quality, frequency, and affordability
Transit agencies have to juggle those three variables
– If you want quality and frequency (universality) you have to skip on affordability or expand your tax bracket to cover the costs to keep up the repairs.
– If you want frequency and affordability, quality has to go….usually that’s met exclusively with buses which can offer quality if steps and measures are taken. Plastic seats aren’t comfy, but they’re easy to clean from the never ending assault of germs, piss, shit, ejaculate and other foul deposits people leave behind.
– And if you want Affordability and quality, frequency has to go…..you must shorten your geographic range to an area where it’s most needed but build a reputation of steady service.
Funnily enough APTA doesn’t seem to have a press release pointing out that areas with high level of transist trips also have high levels of gun violence.