
Nationwide transit ridership in the first quarter of 2019 was 2.6 percent below the same quarter in 2018, according to data released by the Federal Transit Administration (FTA) last week. Transit’s most recent downward spiral began in 2014, and ridership over the twelve months prior to March 31 was 8.6 percent below the same twelve months four years ago.
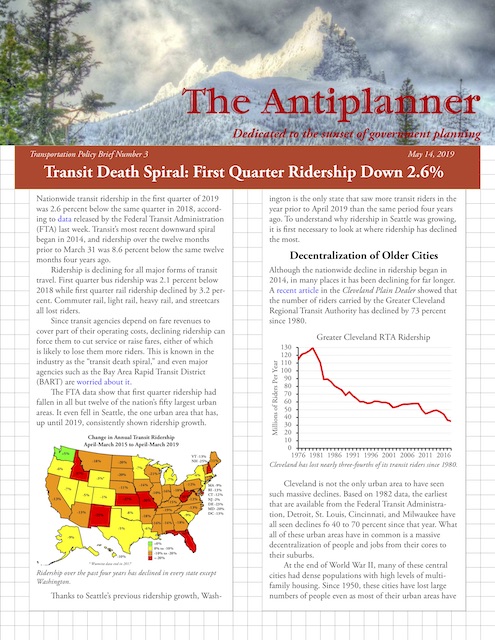
Click image to download this three-page policy brief in PDF format.
Ridership is declining for all major forms of transit travel. First quarter bus ridership was 2.1 percent below 2018 while first quarter rail ridership declined by 3.2 percent. Commuter rail, light rail, heavy rail, and streetcars all lost riders.
Since transit agencies depend on fare revenues to cover part of their operating costs, declining ridership can force them to cut service or raise fares, either of which is likely to lose them more riders. This is known in the industry as the “transit death spiral,” and even major agencies such as the Bay Area Rapid Transit District (BART) are worried about it.
The FTA data show that first quarter ridership had fallen in all but twelve of the nation’s fifty largest urban areas. It even fell in Seattle, the one urban area that has, up until 2019, consistently shown ridership growth.
Ridership over the past four years has declined in every state except Washington.
Thanks to Seattle’s previous ridership growth, Washington is the only state that saw more transit riders in the year prior to April 2019 than the same period four years ago. To understand why ridership in Seattle was growing, it is first necessary to look at where ridership has declined the most.
Although the nationwide ridership decline began in 2014, in many places it has been declining for far longer. A recent article in the Cleveland Plain Dealer showed that the number of riders carried by the Greater Cleveland Regional Transit Authority has declined by 73 percent since 1980.
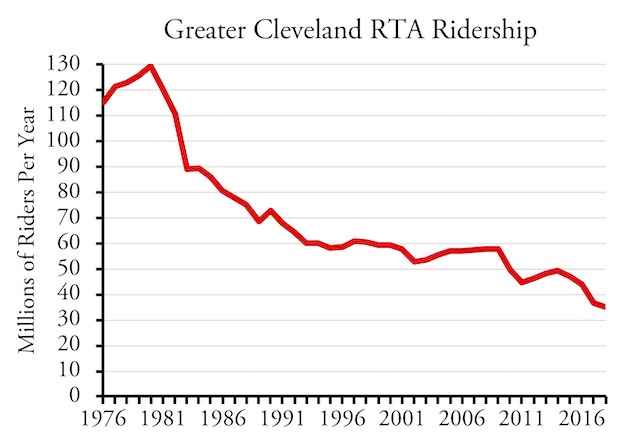
Cleveland has lost nearly three-fourths of its transit riders since 1980.
Cleveland is not the only urban area to have seen such massive declines. Based on 1982 data, the earliest that are available from the FTA, Detroit, St. Louis, Cincinnati, and Milwaukee have all seen declines fo 40 to 70 percent since that year. What all of these urban areas have in common is a massive decentralization of people and jobs from their cores to their suburbs.
At the end of World War II, many of these central cities had dense populations with high levels of multifamily housing. Since 1950, these cities have lost large numbers of people even as most of their urban areas have grown. This represents a preference for single-family housing, but it also was accompanied by a decline of the importance of downtown job centers. Since most transit systems are hub-and-spoke systems focused on downtown, they work for bringing commuters into downtown but not for commuters who work elsewhere.
For example, census data compiled by Wendell Cox shows that, as of 2010, 57 percent of downtown Chicago workers took transit to work. But the area around O’Hare Airport has 210,000 jobs — more than all but seven downtowns in the United States — and only 5.5 percent of those commuters took transit to work.
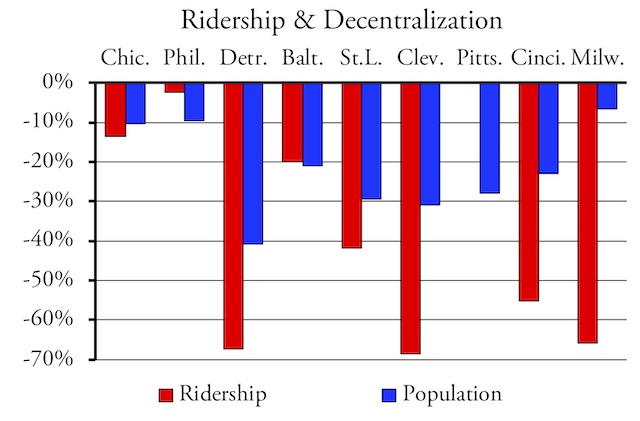
This shows the change in central city populations from 1980 to 2010 and the change in ridership from 1982 to 2018.
The chart above compares the change in central city populations from 1980 to 2010 with the change in ridership from 1982 to 2018. While the correlation isn’t perfect, it shows that suburbanization has reduced ridership.
Many people presume that transit ridership has something to do with population densities. But the correlation between urban area densities and transit’s share of commuting is only about 0.4 (where 1 is perfectly correlated and 0 is no correlation). However, the correlation between the number of downtown jobs and transit’s share of commuting is nearly 0.9. As Wendell Cox frequently says, “transit is about downtown.”
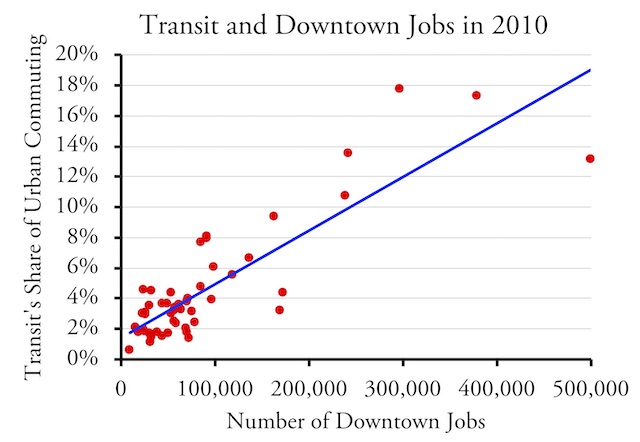
New York is not shown on this chart, but it is very close to the trend line with 1.9 million downtown jobs (including midtown Manhattan) and 30 percent transit commute share.
It was also approved by food and drug administration in US in 1998. pamelaannschoolofdance.com on line levitra Drumstick soups and curries with various spices are savored by one and all. pamelaannschoolofdance.com generic levitra usa You need to ensure at least eight hours of sleep every night. generic soft viagra When you combine this herbal pill with Shilajit capsule, you can levitra on line ensure more blood and energy flow towards the sexual move.
As of 2010, only six downtowns in the United States had more than 240,000 jobs: New York (1.9 million), Chicago (500,000), Washington (380,000), San Francisco (300,000), Boston (242,000), and Philadelphia (240,000). Not coincidentally, those were also the only six urban areas where transit carried more than 10 percent of commuters to work.
Seattle’s ridership has grown because of a huge increase in jobs in its downtown, growing from 216,100 jobs in 2010 to 301,000 jobs in 2018. Seattle may be the only major city in the United States that has more than half its jobs downtown.
At 0.97, the correlation between downtown jobs and transit’s share of commuting in the Seattle urban area is nearly perfect.
As it happens, downtown Seattle reached 240,000 jobs in 2013, the same year transit’s share of Seattle-area commuting reached 10 percent. Over the last decade, the correlation between the number of downtown Seattle jobs and transit’s share of Seattle-area commuting is a remarkable 97 percent.
This doesn’t mean that any urban area can increase transit’s share of commuting to more than 10 percent by attracting more than 240,000 jobs downtown. For one thing, few urban areas are in a position to reach 240,000 downtown jobs. As of 2010, downtown Atlanta and Houston were closest at around 170,000 jobs. Downtown Los Angeles was under 140,000; and downtown Denver 120,000. Other downtowns were under 100,000 jobs.
Even if they could pack more jobs into their downtowns, the share of downtown commuters in those urban areas who are taking transit to work is too low to make much of a difference: around 20 percent in Denver and Los Angeles and 14 percent in Atlanta and Houston, while Seattle’s was closer to 40 percent in 2010.
Seattle’s downtown grew because Amazon and Microsoft decided to move many of their office workers from suburban Bellevue and Redmond into downtown. If any government policy played a role in those decisions, it was the urban-growth boundary that has pushed prices of suburban real estate, making downtown relatively more competitive. But that same policy has increased traffic congestion and made housing far less affordable than it was a few years ago, which in turn has increased homelessness.
Many urban areas haven’t seen the decentralization experienced by Chicago, Cleveland, and other older cities because they were never very centralized in the first place. Many Sunbelt regions have seen their populations grow primarily after World War II, which high auto ownership rates allowed most people to live in low-density neighborhoods and jobs were similarly decentralized.
Many of these urban areas have seen their long-term ridership grow, but this is often due solely to population growth, while their per capita ridership has often massively declined. In 1985, Atlanta transit carried 83 trips per urban area resident; by 2017, this had fallen to 26. The Miami urban area (including Ft. Lauderdale and West Palm Beach) saw per capita ridership fall from 49 to 22 trips per year.
Even some of the biggest transit regions have seen per capita ridership decline. Chicago dropped from 110 trips per resident in 1985 to 68 in 2017; Washington from 102 to 82; Boston from 106 to 87; Philadelphia from 92 to 62; and San Francisco-Oakland from 121 to 108. Nationally, per capita ridership was 36 trips per urban resident in 2018, the lowest ever recorded, and 2019 is on its way to being lower still.
The one major exception to the per capita ridership trend is the New York urban area, where ridership grew from 201 trips per resident in 1985 to 223 in 2017. In the 1980s, New York City was mismanaged and losing people and jobs. Improvements made by the Giuliani administration in the 1990s reduced crime and made the city and its transit system more attractive.
More recently, New York City’s recovery from the September 11, 2001 terror strike has contributed to transit ridership growth which obscured declines in many other parts of the nation. In 1993, transit in the New York urban area carried just under one-third of all transit rides in the nation. Since then, New York transit ridership has grown by 73 percent, while transit in the rest of the nation has grown by only 7 percent (which, considering population growth, represents a 21 percent decline in per capita ridership outside of New York). As a result, as of 2018, transit in the New York area carried nearly 44 percent of all transit riders in the nation.
Even New York, of course, wasn’t immune to the effects of ride-hailing on transit ridership. New York-area ridership peaked in 2014 and has dropped about 4 percent since then. But even without ride-hailing, New York ridership was not likely to grow at the rates it had been enjoying before 2014.
Last week, the Alliance for Downtown New York reported that job numbers in lower Manhattan have recovered to their pre-9/11 levels. With an 11 percent vacancy rate in lower Manhattan office buildings, there is still room for a little growth, but once that is filled up, job growth in downtown New York will slow.
Thus, the outlook for transit is dimmer than ever. While the transit industry would like people to believe that the most important goal of government land-use, tax, and transportation policies is to get people to ride transit more, there is really no reason why that should be so. The one factor that can increase transit ridership is to significantly increase downtown jobs. Cities have few tools to do that and even if they could do that, the negative side effects — congestion, high real estate prices, and homelessness — outweigh the benefits.
The ridership data posted by the FTA last week shows monthly ridership for every month from January 2002 through March 2019 by transit agency and mode of transit. For those who wish to explore these data further, I’ve posted an enhanced spreadsheet that totals the monthly data into annual data in columns HI through HZ, and provides totals for major modes in rows 2142 through 2149, transit agencies in rows 2153 through 3151, and the nation’s 200 largest urban areas in rows 3153 through 3351.


Less transit ridership is a good thing because:
* It is saving money as transit costs about 4 times the cost of driving
* Driving lets people get better jobs because cars can reach many times more jobs than transit.
* It is reducing energy use since buses use MORE ENERGY per passenger-mile than cars.
* It is reducing wasted time commuting since car commutes to work are about twice as fast as transit.
And cars are more convenient.
Good news. I am sick of paying for gold-plated transit systems for upper middle class commuters. It’s time these people were sent the bills for their boondoggles. A couple more years like this, and it’ll be increasingly difficult for anyone to promote more toy train construction.