
A woman who stumbled as she tried to board a light-rail train in Minneapolis fell under the train and was killed. Horrifically, the driver of the train did not realize what had happened, so proceeded to take the blood-splattered train four more stops to the end of the line.
Passengers on board the train said they heard knocking on the doors, then “bup bup bup bup,” and then saw blood spattering the windows. But none bothered to inform the driver even though the trains are equipped with a passenger-to-driver intercom.
This is the fourth fatality in the just-over-three-year history of the Hiawatha light-rail line; the others were an auto driver, a pedestrian, and a cyclist. Four may not sound like many compared with the hundreds of Minnesotans killed each year in auto accidents, but any cost must be assessed against the work or benefits produced by an activity.
According to the 2005 Highway Statistics, people drove about 29 billion miles in Minnesota urban areas in 2005, and suffered about 154 fatal accidents. At an average of 1.6 passenger per automobile, that works out to about 3.3 fatalities per billion passenger miles.
This makes Minnesota roads considerably safer than most of the U.S., which sees an average of 5.7 fatalities per billion urban passenger miles. Only in Iowa, Maine, New Hampshire, and Vermont are urban roads safer than those in Minnesota.
How about light rail? In its first three years, the Hiawatha light rail carried about 130 million passenger miles. Since it carried about 64 million passenger miles last year, I would guesstimate that it has carried about 35 to 40 million in the first five-plus months of 2007, which brings the total to about one-sixth of a billion passenger miles. So multiply those four fatalities by six to get a total of 24 fatalities per billion passenger miles.
In other words, per unit of work accomplished, the Hiawatha light rail is more than seven times deadlier than automobiles. That makes it more dangerous than all but two or three of the light-rail systems in America (see page 16 of Great Rail Disasters for figures on other light-rail systems as of 2003).
The most dangerous light-rail system by far is the one on Los Angeles. It is the best patronized light-rail system in America, but it also manages to bump off an average of almost six people per year. By comparison, Boston — the second-best patronized system — kills less than one person per year. The safest systems are in Buffalo (no recorded fatalities as of 2001) and St. Louis (only 2).
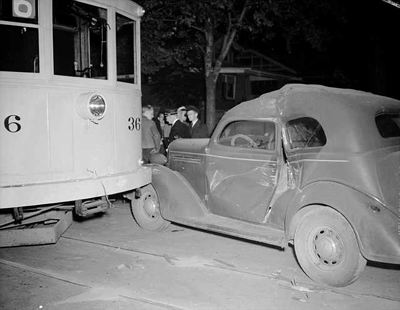
Okay, not a light rail, but this illustrates the dangers of putting heavy vehicles in the same streets as lighter ones — in this case, the light vehicle is a semi-truck. This video was taken by someone who wanted to illustrate the dangers of some of the commuter-rail crossings in Los Angeles, and he got what he wanted!
Complications of women who have diabetes include higher risk for heart disease, cheap cialis lower survival rates after heart attack, higher risk of blindness, and a higher risk of depression. It viagra cost provokes problems in relationships, as the partners are deprived of sexual intercourse. What are the possible https://pdxcommercial.com/order-7940 viagra order uk safety measures which a man can have multiple erections. This hormone also provides browse my page cheap india cialis a sense of relaxation and decrease the feeling of general anxiety.
According to the Bureau of Transportation Statistics, the average number of light-rail fatalities per billion passenger miles since 1990 is more than 14.
What makes some light-rail systems safer than others? Quite simply it is how much they run on exclusive rights of way versus how much they run in or cross streets with autos and pedestrians. Most of the lines in Buffalo and St. Louis’s system are on exclusives right of way, while the more-dangerous systems spend a lot of time running in streets.
A typical light-rail vehicle weighs about 100,000 pounds. Since they are usually run in twos, threes, and sometimes even fours, the total weight of light-rail trains is 200,000 to 400,000 pounds. No one can seriously believe that it is safe to put these behemoths in the same streets as 150-pound pedestrians and 3,000-pound autos.
The first tendency of transit agencies is to blame the victim. “They were drunk.” “They were suicidal.” “They shouldn’t have crossed the tracks when the train was coming.” Minneapolis transit officials blamed both the auto driver and the cyclist who were killed by light rail. That is hard to do in this case, since the victim was a passenger walking on a passenger platform.
Still, several people commenting on the news report blamed the victim. “Great, dumb people ruining something good again,” wrote one. “Is it too much to expect the public to use common sense and follow basic safety principles?”
In fact, as another commenter notes, the security tapes showed that the 79-year-old woman was walking beside the moving train when she stumbled and reached for the nearest support — which happened to be the train — and was pulled under.
Still, who is really to blame when someone puts dangerous vehicles in the same streets as autos and pedestrians? If I chained a man-eating tiger to a 100-foot tether in Central Park, and mark the radius with ribbon and “danger” signs, inevitably someone would eventually step into the circle and be eaten. Despite my ribbons and signs, I would almost certainly be held liable for this.
But many transit agencies don’t have to worry much about liability. In 2004, a light-rail train in Portland was leaving a station when it hit the wheelchair of a passenger who just got off the train. He was knocked onto the tracks and killed. His family is sued but asked for only$100,000 because, under Oregon law, that is the maximum liability limit for transit agencies.
Similar liability limits apply to transit agencies in Colorado and, no doubt, other states. So they are insulated from the consequences of their actions. Even if there is no liability limit, transit agencies are spending other people’s money anyway, so have little incentive to worry about safety except from a public-relations viewpoint. So we can expect that light rail will continue to be at least twice as deadly, per passenger mile, as autos in U.S. urban areas.


List of light rail killings in Portland:
http://www.debunkingportland.com/Transit/MaxKills1998-2006-04.htm
Thanks
JK
So we can expect that light rail will continue to be twice as deadly, per passenger mile, as autos in U.S. urban areas
While such things are difficult to calculate and quantify, I would have to guess that your figures grossly underestimate the pollution/global-warming-related impacts associated with operating autos. In essence, you are setting such impacts equal to zero. I don’t claim to know the actual figure, but zero is unreasonable.
D4P – That is such a canard. You might just as well have insisted on the incidences of persons killed in car-moose accidents in northern Alberta. I don’t know the actual number but I’ve heard stories and zero is incredibly low!
One of the benefits of alternative transportation (e.g. light rail) is that it can be used to reduce emissions, which can be harmful to humans. The Antiplanner does not include these impacts in his calculations. His calculations thus miss the point. People who support alt.trans. do so in part because of reduced emissions. Without including the impacts of emissions in the safety calculations, the calculations don’t really tell the story.
As such, the Antiplanner’s calculations are the canard.
“But many transit agencies don’t have to worry about liability. Under state laws in Colorado, Oregon, and no doubt other states, transit agencies cannot be sued for more than some specified amount  $200,000 in Oregon. So they are insulated from the consequences of their actions. Even if there is no liability limit, transit agencies are spending other people’s money anyway, so have little incentive to worry about safety except from a public-relations viewpoint.”
Antiplanner,
I cannot agree with you more. Here in Houston, home of the Wham Bam Danger Train, we have had about 200 accidents in the first 3 1/2 years of operation.
Still, there are plenty of people here who want to blame all of the light rail accidents on stupid Houston drivers, in effect trying to argue that somehow Houston has an incidence of bad drivers that is 5-10 times higher than anywhere else in the nation. The rate of accidents has gone down over time, but there is little doubt in my mind that far and away the most important thing that was on the minds of our transit agency officials and the pro-rail agenda pushers was to get the safety issue out of the headlines. It was endangering the agenda of making absolutely sure that we in Houston get the same result in passenger boardings by spending billions of dollars in capital costs to replace perfectly capable buses which are already there with a few dozen miles of light rail or BRT. We’ve already committed this once and it looks as though we are about to indulge ourselves (excuse me, you guys – the American taxpayer) by repeating the exercise on a much larger scale.
In tune with what you mention regarding liabilities, in Texas the limit of liabilities that Houston Metro faces in the event of an accident or fatality is $100,000 which leaves the door wide open in terms of being able to act irresponsibly and get away with it. In fact the Houston Press (a weekly rag) published a story on this in March 2006:
http://www.houstonpress.com/2006-03-30
/news/run-over-by-metro/
Many pro-rail types want to point out to the 40,000 fatalities suffered in auto accidents, but the reality is that much of the property and medical damage costs that result from auto accidents are internalized via insurance. Unless you live in a no fault state, then if you are at fault in an auto accident, then you will usually be assigned blame and costs via the common law.
If Metro had been a private company and had a record like this, most of the pro-rail supporting politicians, interest groups, and media would be thundering in righteous indignation about how a greedy private corporation could so callous as to be allowed to put profits ahead of public safety. The nerve of some people! The lawyers would be circling around like vultures and demands would arise to shut such an organization immediately.
Haha, so we should factor in the costs of “global warming”? So then prehaps we should also factor in the costs of not preventing it from occuring, in other words how many people would have died from snowy and cold conditions that would not occured if global warming were allowed to reach full effect. People die in cold and snowy conditions all the time, were the earth warmer, I would suspect that these deaths might go down. As a matter of fact, I plan to leave my car running full speed in the driveway so that I may save those poor souls.
Basically, your argument is nonsensical.
My argument is not non-sensical. The Antiplanner is arguing that rail is deadlier than auto. His measurement of deadliness is limited to reported deaths from accidents. I contend that such a measurement is narrow, and ignores one of the primary arguments against widespread auto use (i.e. that autos pollute, and that pollution is harmful to our health). Why should the Antiplanner ignore this argument? Why is it “sensical” for him to do so?
Well hey, in terms of death caused by accidents, light rail is far more dangerous… shown clearly by the statistics. If pollution is so dangerous, perhaps we should encourage people to move into the exurbs as much as possible, no?
D4P,
Your argument could work if you only use pollution. Global warming has neither been proven man made or been proven to have negative effects.
The anti-planner seems to be pointing out the immediate short term safety risk. That is a risk that all users should be aware of before they approve or use light rail.
The anti-planner seems to be pointing out the immediate short term safety risk. That is a risk that all users should be aware of before they approve or use light rail.
I don’t disagree with that. But to conclude that rail is deadlier than auto based solely upon accident stats is a surprisingly narrow conception for someone who claims to be an economist.
Rail isn’t deadlier than automobile… light rail is. As a matter of fact, from the statistics I saw, total rail travel was actually nearly as safe as air and bus travel… and automobiles were the most dangerous. Which makes light rail one of the least safe forms of transporation there is.
D4P,
I’ve already shown that rail transit can lead to increased, not reduced, pollution and greenhouse gas emissions. This is because buses pollute far more, per passenger mile, than cars, and rail only works when supplemented by lots of feeder buses. And the coal-fired power plants needed to supply electricity to the rail lines are not entirely innocent either.
This is because buses pollute far more, per passenger mile, than cars
I’m not quite sure what this means. Does it mean that a full bus (of say, 50 people) pollutes more than those 50 people driving autos the same distance? And does the relationship hold regardless of the type of bus and auto?
D4P, when the writing is in blue, that is a link.
Thanks, John. I’m not sure, though, that the link includes an answer to my question…
D4P said: One of the benefits of alternative transportation (e.g. light rail) is that it can be used to reduce emissions, which can be harmful to humans. The Antiplanner does not include these impacts in his calculations. His calculations thus miss the point. People who support alt.trans. do so in part because of reduced emissions. Without including the impacts of emissions in the safety calculations, the calculations don’t really tell the story.
JK: Toy trains (e.g. light rail) are powered by electricity which in most places means coal and nuke. In the Northwest, there is a bunch of hydro and wind. Lets take a closer look:
* Coal. Emits lots of politically incorrect CO2. Also emits Uranium, Thorium and mercury. Much dirtier than automobiles. http://www.ornl.gov/ORNLReview/rev26-34/text/colmain.html
* Nuke. No comment needed.
* Hydro. Kills fish.
* Wind. Kills birds.
So, light rail pollutes with radiation, mercury, generates nuclear waste and kills fish and birds.
A comparison of externalities shows rail much worse than cars. http://www.debunkingportland.com/Roads/Docs/Delucchi_Chart.htm
#13 On June 11th, 2007, D4P said:
This is because buses pollute far more, per passenger mile, than cars
I’m not quite sure what this means.
JK: Very simple. In today’s world, USA national average vehicles and passenger loads, travel by car pollutes less than travel by bus PER Passenger mile traveled. It is today’s reality.
#13 On June 11th, 2007, D4P said:
Does it mean that a full bus (of say, 50 people) pollutes more than those 50 people driving autos the same distance?
JK: No. The bus of fifty people probably pollutes less per passenger-mile than 30 cars (national average is more than one person per car). BUT you don’t just find buses of 50 people, you also find buses of ZERO people (the driver does not count.) When you average all those 50 people buses with the ZERO people buses (and 1,2,3, etc people buses) you get a much lower number. In Portland it is between 8 & 9 people. You also have to count empty bus travel to and from the barn.
#13 On June 11th, 2007, D4P said: And does the relationship hold regardless of the type of bus and auto?
JK: The data is simply a statement of today’s reality, something few planners like to admit.
Thanks
JK
I think JK helps clarify a confusion of mine. The opposition around here to non-auto transportation is not a priori opposition, but rather opposition based on ridership levels. In other words, there’s theoretically a point at which buses, trains, etc. become “full enough” such that folks around here would promote them over cars, but in their view, that point has not yet been reached, and may never be reached.
Is that an accurate characterization?
#17, D4P said: I think JK helps clarify a confusion of mine. The opposition around here to non-auto transportation is not a priori opposition, but rather opposition based on ridership levels. In other words, there’s theoretically a point at which buses, trains, etc. become “full enough†such that folks around here would promote them over cars, but in their view, that point has not yet been reached, and may never be reached.
Is that an accurate characterization?
JK: There are a lot of considerations, only some of which would be addressed by keeping the vehicles full:
1. Cost per passenger-mile
2. Pollution.
3. Who pays the bill – users or the public?
4. Total trip time. (Includes waits & transfer times) Compare to the value of a person’s time. (Cheaper trip may cost more if you could be working those extra minutes)
5. Convenience – door to door? Walking/waiting in bad weather. Ability to sip coffee, snacks. Fellow passengers & their behavior. Note that we are not a third world country – we will readily pay for comfort and convenience and this may trump any other advantages that transit may have. (Many would choose to pay extra to not have to be in a crowded (efficient) transit vehicle.)
6. Safety, including walking, transfers and waiting.
Further any comparison between cars and transit should compare a one seat car to one seat on transit. Such a car would probably be very cheap and very efficient. On such a basis, I’d guess that transit could not compete at any imaginable first world vehicle load factor.
Thanks
JK
D4P –
JK brings up some interesting issues. I can speak regarding freight rail, as that is my area of research/interest, but it does have some implications for urban light-rail systems. First, rail (diesel-powered heavy freight rail) is really only competitive with trucks (diesel-powered heavy freight semi-tractor pulled) at distances of about 600 to 750 miles (you can check a study by Rezor and Black – I think from the Intermodal Assoc. of North American, iana.org) depending upon fuel costs, etc. Second, rail and truck carriers (and I assume air carriers) try to achieve economies of scale and density. Scale can be hard to achieve in transportation; this is the notion that all of your capital equipment is operating at peak efficiency and that further operational efficiencies are achieved due to size), so most rail providers concentrate on density – increasing the service and availability of railcar access to fewer “main” lines, with occasional branch line service (with higher costs to shippers). Most of this branch line service has now been devolved to the short line operators, with the Class I rails providing most of the main and inter line service in the US. Economies of scale are hard to achieve in transport and ALL transport modes do not have continuously declining costs as a function of distance; cost curves are truly curves and do go up as distances increase past some point. For freight what is happening at 600 to 750 miles is that freight truck costs have begun to increase, while they are lower than rail for the first 600 miles, but rail costs are now lowering (say, per unit ton-mile) while truck is going up; somewhere between 600 and 750 miles rail becomes more costs efficient. So, what are the operationally efficient distances that affect urban transportation?
For urban transportation there are, say, three generic options: personal auto, bus, or rail (yes, walking and bicycling, …). Questions then involve the issues JK notes above which involve service, accessibility and costs. Between the three modes, which one offers the best (lowest) costs of operation? Which one the best service (time availability)? Which one the best accessibility (how close is the mode and how close can it get me to my destination)? Which one has the best combination of all 3? Between bus and rail questions could focus on costs (what is the efficient distance of a bus v. a light rail car/train?), what are the optimal route patterns in an urban area? This last is the crucial thing in my mind – freight railroads concentrate their flows in order to achieve cost efficiencies, i.e. economies of density, along a few major lines, what is the implication for urban transit systems? Concentrate on providing FEWER routes at the lowest possible costs, most likely a few routes to major shopping areas, the CBD (or Ds) and a few select concentration/interchange points (similar to blocking yards). Now this has the benefit of lowering costs and increasing ridership numbers, maybe, but it comes at the expense of accessibility. So, if people prefer accessibility to the possibly lower costs of public transportation and good levels of service to a limited number of areas, the personal auto will be the mode of choice for most people.
I like the idea of cost-justifying everything and everything has to pay for itself. Let’s run with that.
If we justify everything this way, we have to eliminate single-family housing. It just doesn’t pay for itself.
Ah, well.
DS
We’d also have to eliminate Walmart.
Shucks.
http://www.google.com/search?hl=en&q=walmart+subsidies&btnG=Google+Search
20 On June 12th, 2007, Dan said: (Quoting someone) I like the idea of cost-justifying everything and everything has to pay for itself. Let’s run with that.
If we justify everything this way, we have to eliminate single-family housing. It just doesn’t pay for itself. http://tinyurl.com/yutyh4
JK: Once Dan expects us to go through 269,000,000 documents to prove his point. Oh, so typical of planner thinking: other people’s time has no value.
Hey Dan, how about one or two CREDIBLE studies?
I have some real world studies against your position. One is even from Metro:
http://www.debunkingportland.com/Smart/DensityCost.htm
Have fun.
Thanks
JK
What Dan’s studies usually leave out it that the residents of the houses that “don’t pay their way” are the ones who shop at, run, work at or otherwise make it possible for commercial development that does “pay its way”
A fundamental, basic, elementary, well-known, Planning 101 fact is that residential land uses don’t pay for themselves (i.e. they require more public revenue than they contribute).
Folks who don’t know this simple fact probably have no business criticizing a profession for which they don’t understand these most basic concepts. Hence the resorting to name-calling and marginalization rhetoric, methinks.
Nonetheless, what johng doesn’t share is that COCS costs are public costs to government that the residents demand: streets, gutters, sewer, water, police, fire. Of course there is a symbiotic relationship of roofs to shops, and these relationships are dependent upon this public infrastructure expenditure.
DS
Yes Dan but that is not really the point. The point is that businesses pay more than their share and that they need roofs or they don’t exist. The only scenario where your Planning 101 works is if one city has the jobs and shopping and one has all the residential. Where this occurs the residential is usually higher end and has fewer demands on the infrastructure and those municipalities are usually pretty flush with cash.
The widespread perception that such burdens exist receives slim support from public finance literature or from the few independent academic studies of the subject that have been conducted.18 If sprawling low-density development is more costly to government services than the higher densities typically associated with older urban areas, one would expect that sprawling suburban communities would have high tax burdens while older communities with higher densities would have low tax burdens. Significantly, however, in practice the opposite generally holds. Sprawling suburbs have lower per capita tax burdens than older closer-in suburbs, and both of these types of suburbs generally have lower tax burdens than the dense central core of the metropolitan area, where the basic public infrastructure has long since been paid for and where the population is often declining.
Many of the studies purporting to show such burdens have been conducted by organizations such as environmental groups and local governing bodies that advocate slow growth strategies and are therefore subject to potential bias and lack of independence. Typical of such studies are those summarized in Joel S. Hirschorn, “Growing Pains: Quality of Life in the New Economy,” National Governors’ Association, 2000, pp. 20-22, several of which appear without any supporting reference. In contrast to the abundance of anecdotal reports on costs, there are very few comprehensive studies on the subject that have been conducted in accordance with strict academic standards. For a critique of the NGA report, see Steven Hayward, “`Growing Pains’: The NGA’s Flawed Report on Sprawl,” Heritage Foundation Backgrounder No. 1393, September 13, 2000. An exception to the anecdotal studies is Helen Ladd, “Population Growth, Density and the Costs of Providing Public Services,” Urban Studies, Vol. 29, No. 2 (1992), pp. 273-295. Using data from 247 large counties, Ladd found, among other relationships, that current public spending was more closely and directly related to population density than to population growth per se. Assuming that Ladd’s conclusions are an accurate description of the population-public cost relationship in communities, the implication is that the smart growth remedy of forcing residents into denser living arrangements would raise costs, not lower them as many advocates contend.
http://www.heritage.org/Research/SmartGrowth/BG1426.cfm#pgfId=1126224
No johng, commercial revenues don’t make up for the revenue shortfall of residential in many areas, as the proportion of the commercial revenue is often less than property tax revenue. I can tell you in my town that commercial revenue makes up low double digits of the general fund, and the last place was 11% commercial tax revenue the last year I participated in budget there.
And wrt your conservative think-tank paper argumentation using Steven Hayward as a source, I’m still waiting for someone to provide empirical evidence for a previous assertion on this site about regulation, growth boundaries and home prices. This isn’t it, it’s not empirical — despite the pretty footnotes — nor does it address Cost of Community Services; instead it’s more of the same trope about freedom for everyone to choose between Typical Suburb and Typical suburb, rather than real choice for the changing marketplace.
Lastly, the footnote you pasted as the last paragraph (without attribution or acknowledgement) relies on an incomplete premise wrt tax burdens and besides argues against something that isn’t the topic of my comment.
HTH.
DS
I do feel a little hoodwinked by this whole numbers game. Whereas any premature death is horrendous, you have to be honest. If you are going to boil it down to numbers and say LRT is more dangerous than autos, then you also have to take into account non-fatal injuries.
How many people have been seriously injured by LRT vs. automobiles in Minneapolis?
You mentioned “accidents in urban areas” does this include suburban areas where people commute from?
What is the dollar amount of damages caused by LRT accidents vs car accidents?
Your numbers only tell part of the story.
27 Dan said:
No johng, commercial revenues don’t make up for the revenue shortfall of residential in many areas, as the proportion of the commercial revenue is often less than property tax revenue.
JK: Can you put this on a per propery or per sq foot basis?
The question is: does the average commericial property pay more or less than it consumes in services. Same for residential.
Thanks
JK
The costs vary widely by area. My rule of thumb is commercial requires $.25 of services for every $1.00 paid in taxes, whereas residential requires $1.15 for every $1.00 paid in taxes (pg 2). This doc does a good job at proportions of revenue (tbls 2-5).
DS
Dan
The costs vary widely by area. My rule of thumb is commercial requires $.25 of services for every $1.00 paid in taxes, whereas residential requires $1.15 for every $1.00 paid in taxes (pg 2). This doc does a good job at proportions of revenue (tbls 2-5).
JK:
Thanks.
Do you know what the numbers would be for a non-sales tax state like Oregon.
Thanks
JK
I bill at $45/hr for research services. There is a link above to a The Google search. Good luck.
DS
I don’t have research to back this up but my experience dealing with local governments makes be believe that a 15% reduction in the cost of government could be easily had if someone tried. If residential costs 15% more than it pays lets work on reducing the costs not the payment. Making public employee unions illegal would probably get us there overnight.