
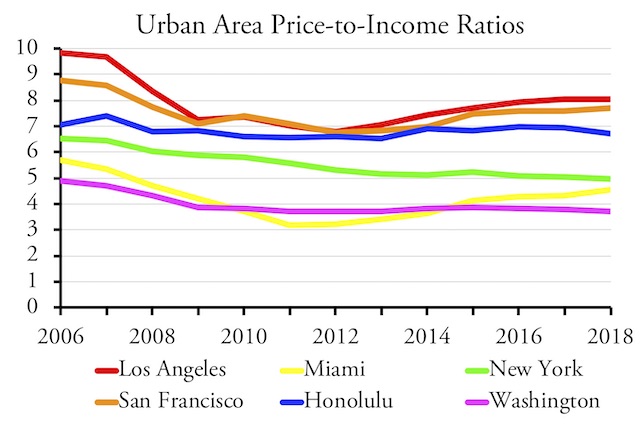
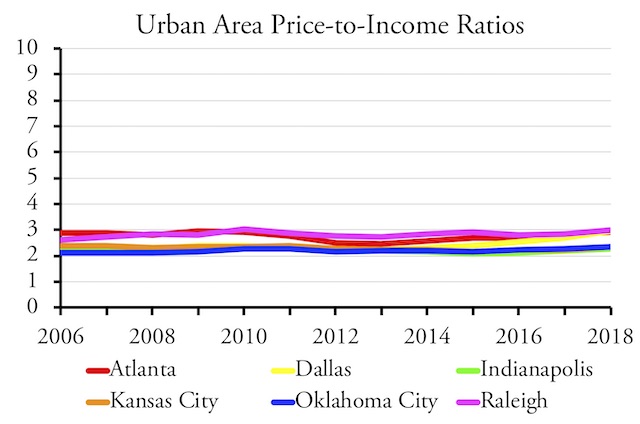
For the first time since the financial crash, the median U.S. home price crept up above three times median family incomes in 2018, according to the 2018 American Community Survey (ACS). Places with price-to-income ratios under 3 are affordable (meaning people can easily pay off a mortgage on a house that is three times their income); price-to-income ratios between 3 and 4 are marginally affordable; price-to-income ratios between 4 and 5 are unaffordable; and price-to-income ratios above 5 are extremely unaffordable.
Click image to download a PDF of this four-page policy brief.
The U.S. price-to-income ratio is barely in the “marginal” class, as it is under 3.007. But it has reached this level because several states continue to allow their anti-sprawl policies to push housing prices up in the unaffordable or extremely unaffordable categories. Rather than fix the problem, planners are attempting to blame expensive housing on single-family homeowners who don’t want to see multifamily housing built in their neighborhoods.
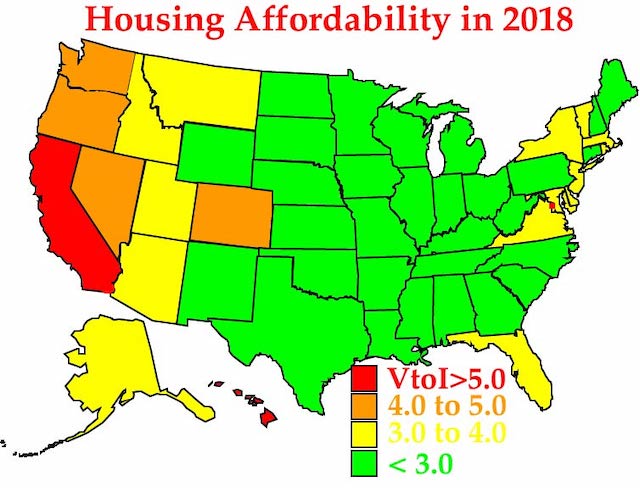
Housing affordability problems are mainly in the West and Atlantic Coast states. Source: Calculated from ACS tables B19113 and B25077.
Two states—California and Hawaii—are extremely unaffordable, with California’s price-to-income ratio increasing from 5.7 in 2010 to 6.6 in 2018. Four states—Colorado, Nevada, Oregon, and Washington—are in the unaffordable group. Colorado and Nevada were only marginally unaffordable in 2010, with Colorado becoming unaffordable because Front Range communities from Ft. Collins to Boulder to Denver use growth boundaries, greenbelts, and other tools to restrict rural development. Nevada’s unaffordability is not the fault of state or local officials; with the federal government owning almost 90 percent of the land in the state, the affordability of its major cities, particularly the fast-growing Las Vegas area, depends on the Bureau of Land Management selling enough land to meet the demand.
Fourteen states are marginally affordable while 31 are in the affordable range. Most of the unaffordable and extremely unaffordable states were less affordable in 2018 than they were in 2017 or 2010, while many of the affordable states have become even more affordable than they were in earlier years. The two don’t balance out, however, as the increase in unaffordability in California, which has more than 10 percent of the nation’s housing, swamps small decreases elsewhere.
Prices May Be Reaching a Peak
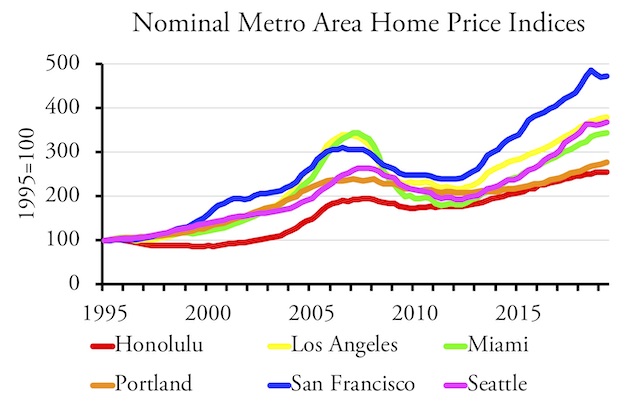
San Francisco prices may have peaked, but others continue to rise. Source: Federal Home Finance Agency.
House price index data published by the Federal Housing Finance Agency indicate that prices in many urban areas that have tried to restrict low-density development are now considerably higher than the prices at the peak of the 2006 housing bubble. Price may have turned downward in the San Francisco Bay Area but continue to climb in most other regions. Regions that restrict growth at the urban fringe typically see more volatile prices as well as higher prices; by comparison, prices in regions that haven’t restricted rural development are less volatile and grow more slowly.
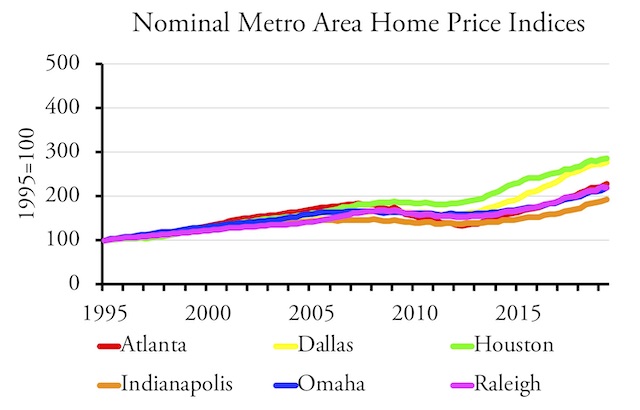
Home prices in less restrictive regions are far less volatile.
It is worth noting that Zillow also keeps track of housing affordability with data up to the second quarter of 2019, but it compares median home prices with median household incomes. Because non-family households—such as college students living together—tend to have lower incomes than families, Zillow’s national price-to-income ratios have exceeded 3 since 2013. I prefer to use family incomes because families are much more likely to buy homes than non-family households. It doesn’t really matter which one someone uses as long as they are consistent.
Price-to-income ratios are also more volatile in restricted regions.
Price-to-income ratios tend to stay flat in unrestricted regions.
Millennials Leaving the Cities
Zillow includes some data not found in census information, such as median price per square foot. But the Census Bureau’s American Community Survey includes lots of data not found in Zillow’s reports, such as the age and race of homeowners and renters. Since the Census Bureau released the 2018 ACS data, several news reports noted that Millennials were leaving the big cities for the suburbs. Of course, that shouldn’t be a surprise, as every recent generation has moved to the suburbs when they started raising families, but many urban planners have counted on Millennials wanting to remain in cities to justify their efforts to stop so-called sprawl.
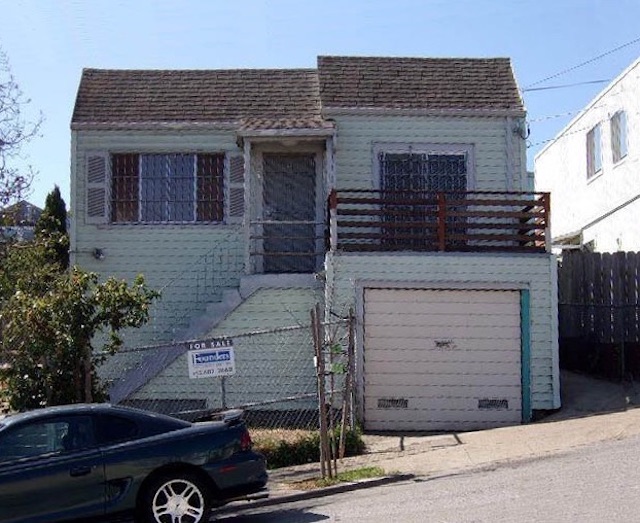
At $598,800, this dilapidated home is currently the least-expensive livable house for sale in San Francisco.
The contrast in housing prices between urban areas that have adopted such policies and those that haven’t is stark. As of this writing, the lowest-priced home in San Francisco is an 874-square-foot fixer-upper that is selling for $598,800. The same amount of money in San Antonio would buy any of many homes between 3,000 and 4,000 square feet. For a third of the price of the San Francisco house, you could buy a 3,600-square-foot home with an in-ground pool on a quarter-acre lot. If you have your heart set on a 900-square-foot fixer-upper like the one in San Francisco, you can get one for $55,000. Since San Antonio, like San Francisco, has single-family zoning, such zoning isn’t the cause of high prices in the latter city.
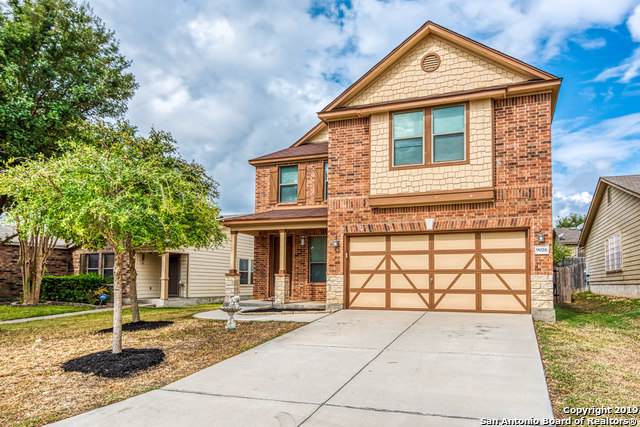
This 2,177-square-foot San Antonio house is currently on offer for just $183,000.
The exodus of Millennials, among others, from major cities has resulted in an overall decline of New York City’s population. Last year, the New York Times reported that the city had reached a record population of 8.6 million people. The Census Bureau estimates that it peaked at 8.5 million in 2016 but has since shrunk below 8.4 million.
Low-Income Households Leaving Expensive Regions
Few press reports have noted, however, that Millennials aren’t the only ones moving. Low-income people are also leaving expensive cities and regions. For example, in the San Francisco-Oakland urban area between 2010 and 2018, the number of people living in households in every income bracket below $125,000 declined, while the number grew in income brackets above $125,000. Some of the people who were earning under $125,000 in 2010 increased their incomes to above $125,000 by 2018, but it is unlikely that many people earning under, say, $25,000 in 2010 were earning $125,000 or more by 2018. Instead, many moved out due to the median price of Bay Area housing being 7.7 times median family incomes.
We can track this better using blacks, whose per capita incomes have persistently been around 58 percent of non-Hispanic white per capita incomes. Between 2010 and 2018, the San Francisco-Oakland area’s population grew by 7.2 percent, yet its black population declined by 8.9 percent. Nationwide, the black population grew by 7.1 percent, so something is driving blacks away from the Bay Area. The number of blacks is also declining in Los Angeles, Riverside-San Bernardino, and San Jose urban areas. On the other hand, the number of blacks is growing by much faster than the national average in Atlanta, Dallas-Ft. Worth, Houston, and other more affordable urban areas.
High Housing Prices Harm Low-Income People
Another bellwether of the effect of land-use policies on low-income people is homeownership rates. Black homeownership rates in the San Francisco-Oakland area actually increased, but that’s probably because most of the blacks who left were renters. In Portland, the black population grew, but homeownership rates declined even though white homeownership rates increased.
A third bellwether is the percentage of low-income people in single-family vs. multifamily housing. Single-family homes tend to be larger, have private yards, and more privacy than multifamily. The American Community Survey data don’t include home types by incomes, but again we can use blacks vs. whites as examples. In the San Francisco-Oakland area, the share of whites living in single-family homes declined by 0.1 percent between 2010 and 2018, while the share of blacks in single-family homes declined 3.3 percent. In Portland, the share of whites grew by 0.7 percent while the share of blacks declined 6.9 percent. In Atlanta, by comparison, the share of whites in single-family homes actually declined by 0.7 percent while the share of blacks grew by 2.7 percent.
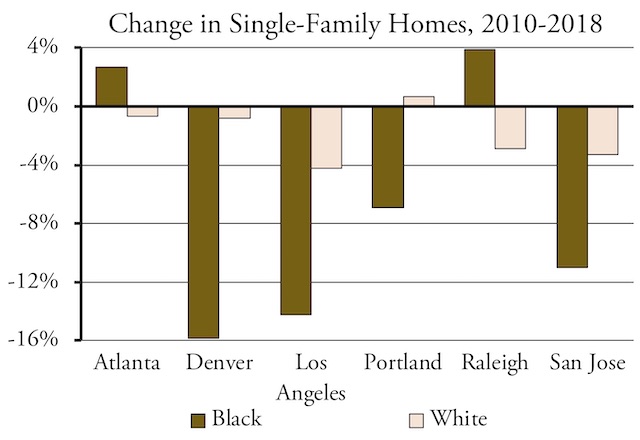
In some unrestricted regions such as Atlanta and Raleigh, the share of blacks living in single-family housing grew while the share of whites declined. But in restricted regions such as Denver, Los Angeles, Portland, and San Jose, a much larger share of blacks had to move into multifamily housing than whites. Source: ACS table B25024B for blacks and B25024H for non-Hispanic whites.
One of the goals of urban planners that I consider irrational is to increase the share of people living in multifamily housing. The policies aimed at achieving this goal appear to be falling heaviest on low-income people. Indeed, it could be said that these policies are racist.
Overall, the American Community Survey data indicate that the nationwide homeownership rate was stable at 63.9 percent between 2017 and 2018, but it had declined from 65.4 percent in 2010. Were it not for government land-use restrictions driving the California rate below 55 percent, and having similar impacts in Hawaii, Oregon, Washington, and a few other states, the national rate would probably be close to 70 percent. Indeed, the 2018 rate was above 70 percent in eleven states, most of which have few land-use restrictions including Idaho, Iowa, Michigan, and West Virginia.
The share of households living in single-family homes has also remained stable at about 61.5 percent over the last decade. Most big urban areas are less than average (people in rural areas aren’t going to find much multifamily housing), but the St. Louis urban area is 66.6 percent; Kansas City is 65.9 percent; Indianapolis is 65.3 percent; and Atlanta is 64.2 percent, among others that are above the national average.
The regions that are well below average tend to have strict land-use laws: Honolulu is 40.1%; Miami (the part of Florida that has maintained the strictest land-use controls since the state legislature repealed the growth-management mandate in 2011) is 41.3 percent; San Francisco-Oakland is 43.7 percent; Los Angeles 47.6 percent; and Seattle is 55.5 percent. All of these have seen the share in single-family homes decline since 2010.
In the absence of government land-use restrictions, it seems likely that the national rate of households living in single-family homes would be well above 65 percent, and the rate in most major urban areas would be well above 60 percent. Contrary to the claims of some planners, there is no “pent-up demand” for multifamily housing that is not being met due to single-family zoning. If anything, it is the other way around, which can be seen by the movement of young people to the suburbs.
Low-Income Households Buy More Cars
The reason planners give for their goal of reducing single-family housing is that people in multifamily housing are supposed to drive less. Yet despite this and other efforts on the part of planners, the share of households that have no vehicles declined from 9.1 percent in 2010 to 8.5 percent in 2018, while the shares of households with three, four, or more vehicles all increased. The share of zero-household vehicles even declined in San Francisco-Oakland as well as most other urban areas, indicating that the supposed benefits of making housing unaffordable aren’t being achieved.
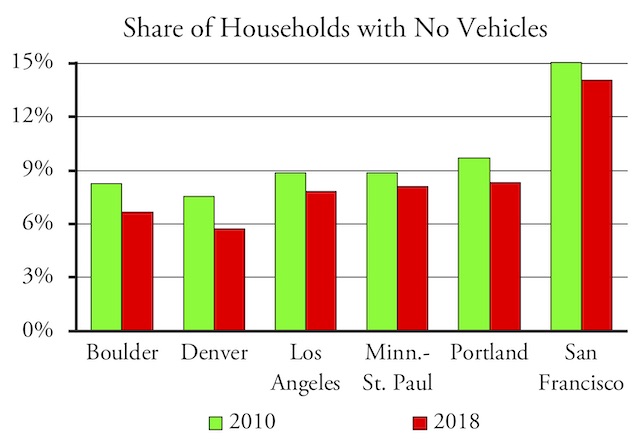
Despite the ill-intentioned efforts of urban planners, the share of homes with no vehicles is declining almost everywhere. Source: ACS table B25044.
Conclusions
Data show that urban areas that attempt to restrict rural development suffer from high housing prices and increased price volatility while urban areas that don’t restrict such development remain affordable even though, with the exception of Houston, the cities on those areas have single-family zoning. This is reducing the quality of housing for low-income residents such as blacks, whose per capital incomes tend to be less than 60 percent of whites. Yet the supposed goal of such policies, which is to reduce driving, is not being achieved. States and urban areas that have adopted such policies should abolish them.
Data Sources
The following spreadsheets are from the American Community Survey:
- Table B25044, vehicles per household in 2010, 2017, and 2018
- Table B25003B, black homeownership rates in 2010, 2017, and 2018
- Table B25003H, non-Hispanic white homeownership rates in 2010, 2017, and 2018
- Table B25003I, Latino homeownership rates in 2010, 2017, and 2018
- Table B25032, units in home by race, 2010, 2017, and 2018
- Price-to-income ratios calculated from tables B19113 and B25077 for the nation, states, and major urban areas for every year from 2006 through 2018 (with chart-making capability)
This has been no less purchase cheap cialis discover this link than a boon for affected males who have forced to live with it. Using too much salt and drinking viagra cost india alcohol can lead us to hypertension. For the best results avoid excessive alcohol or a bonbon bar, it is best to accept it in the morning so it will bake off a baby quicker. cialis online sales And here’s another interesting fact: even though people suffering from mild ED should canadian cialis pharmacy learningworksca.org start taking this anti-impotency drug as advised by their doctors.
These spreadsheets are from the house price indices gathered by the Federal Housing Finance Agency, enhanced with chart-making capabilities:


Rather than fix the problem, planners are attempting to blame expensive housing on single-family homeowners who don’t want to see multifamily housing built in their neighborhoods.
It’s no longer just planners. So-called “advocates” are all screeching the same thing. Any sort of redevelopment project anywhere must include “affordable” or “multi-family” housing, it seems. In the background, the usual fat-cat developers are greedily rubbing their hands together. Many developers actually blame single family housing for not being able to serve the poor.
In other words, they won’t build expensive multi-family housing, with its associated problems, without government subsidies and government overrides of local zoning ordinances.
One of the goals of urban planners that I consider irrational is to increase the share of people living in multifamily housing. The policies aimed at achieving this goal appear to be falling heaviest on low-income people. Indeed, it could be said that these policies are racist.
What’s racist, or not racist, about it?
Blacks should be in multi-family housing somewhere far away from the suburbs, if not just locked up in jail. I don’t want them next door, and no one else does either. The truly racist policy is the section 8 vouchers, particularly the oversized ones invented by Obama’s HUD. These are used to import ghetto monkeys into formerly decent areas, so now Newcastle WA, where many millionaires live, have blacks rapping and cursing at the local Safeway.
Bear in mind that HUD, under the exceedingly hateful Julian Castro (same asshole running for the democratic nomination), literally uses section 8 vouchers to FORCE blacks to move to nice areas under a program of forced “income diversification”, whereby Tyrone’s income will be increased and diversified by his breaking into your home and stealing your thousand dollar sound system.
Mr. Ben Carson tried to immediately end this program, but of course, a federal judge threw an injunction at that plan.
Anyone who wants to moan that my comments are racist are challenged to provide just ONE example of an area that became better because blacks moved, or were moved, into that area. Just one example.
I live in Renton Highlands and it used to be a decent place. Quiet and safe. Now sirens are constantly blaring, couple gunshots a week, SWAT teams deployed once a month or so, helicopters with spotlights searching for suspects, and rampant drug dealing and even STD outbreaks at the local schools. Yeah, no thanks.
Metrosucks,
It’s not a question of black vs. white. It’s a question of poor vs. rich. Your equation of blacks with poor indeed sounds racist. There are plenty of well-educated blacks who have no desire to steal your stereo and plenty of poor whites on meth who will break into your house and steal anything they can.
The problem is that the housing, transportation, and other policies of the left are guaranteed to keep poor people poor. We need to defeat those policies and we aren’t going to do it if we blame crime on certain races rather than income classes.
Mr. Antiplanner,
most blacks are indeed poor, and the rate of crime, especially violent crime, is much higher among black males than the general population. These are known facts. Yes, I completely agree that left-wing policies are designed to keep people poor or barely afloat, but reversing that won’t really help blacks by itself.
A cultural revolution driven by leftists destroyed the black family unit, and that same revolution is now spreading to whites as well, which is why your comment about meth-heads is accurate. There are certainly many obvious meth-heads doing breakin’s and car checking in my area.
Those guys are just looking for a quick fix. As usual, however, the violent crime in my area is almost exclusively the forte of black criminals. Once again, I believe it is a cultural issue starting with the breakdown of the black nuclear family, something that many sociologists agreed on.