
This policy brief is a summary of a lengthy report by Thomas Rubin and James Moore that was recently published by the Reason Foundation as fifteen separate documents. A complete copy of their report in one document, with a few error corrections and other improvements, can be downloaded here.
Click image to download a four-page PDF of this policy brief.
In February 2019, the Los Angeles County Metropolitan Transportation Authority (Metro) board of directors adopted the 28 by 2028 Plan, which proposes to complete 28 major transportation projects prior to the beginning of the 2028 Los Angeles summer Olympics. This proposal includes 20 projects specified in Measure M, a 2016 sales tax ballot measure, plus accelerates the completion of eight more projects.
Metro has a long history of overpromising and then failing to deliver on such projects, ultimately making conditions worse for Los Angeles transit users. The 28 by 2028 Plan appears to continue this pattern.
Metro’s Fluctuating Ridership
Metro provides the majority of transit services in Los Angeles County. Metro’s ridership record, along with that of its predecessor agencies, shows large variations in annual boardings, ranging from under 200 million to nearly 500 million per year. Most recently, the trend is mainly down. Considering population growth, Metro’s per capita ridership is down almost 40 percent since 1985.
The numbers are even worse when the difference between linked trips and boardings (unlinked trips) is taken into consideration. If a rider gets on a bus near her home that goes to a rail station, boards a train, and exits the rail station to her job, this creates two unlinked passenger trips, one each on bus and rail, but only one linked passenger trip. In the early 1990s, when Los Angeles had few rail lines, surveys found that riders took an average of 1.65 unlinked trips per linked trip. By the early 2000s, when Los Angeles had several more rail lines and many one-time through bus lines had been converted into feeder/distributor routes for the rail lines, the average rider took 2.3 unlinked trips per linked trip. Applying this to the almost 40 percent reduction in per capita unlined trips means the reduction in linked trips per capita is over 55 percent.
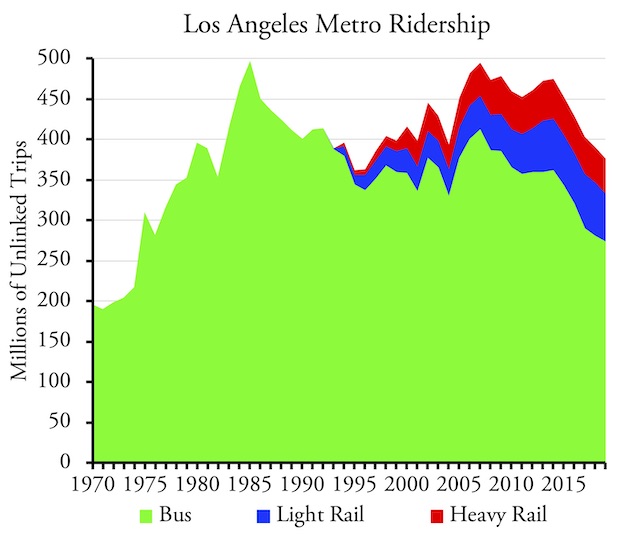
Metro transit ridership since 1970 has fluctuated tremendously and since 1980 those fluctuations have mainly been in response to changes in fares and service levels.
Ridership hasn’t always been declining. Since 1970, there are three periods during which Metro transit ridership increased very significantly. From 1970 through 1980, ridership rose 102 percent (7.3 percent per year). From 1982 through 1985, ridership rose 40 percent (11.2 percent per year). From 1996 though 2007, ridership rose 36 percent (2.8 percent per year). These were three of the largest ridership gains recorded for any transit agency in the modern era.
How Metro Ridership Grew
Several factors contributed to the ridership gains of the 1970s. First, the oil embargo imposed by the Organization of Petroleum Exporting Countries increased the inflation-adjusted average price of gasoline in California by 117 percent between 1972 and 1981. Second, Los Angeles County experienced a large and rapid demographic shift that included increased numbers of lower-income residents who had limited options with respect to automobility. During this period, inflation-adjusted cash fares remained relatively constant. While accurate service data are not available, indications are that there were significant service increases during this period.
Funding shortfalls led to an increase in cash fares from 55¢ in 1980 to 85¢ in 1982. Low-income riders are predictably price sensitive, and this led to an 11 percent drop in ridership.
Following the passage of Los Angeles County’s first half-cent sales tax primarily for transit, cash fares were reduced from 85¢ to 50¢ in 1983 for a three-year period. Other fares were proportionately reduced, leading to heavy use of a $20 monthly pass and a $4 monthly pass for elderly and handicapped riders. Total ridership increased by more than 40 percent, with peak-period ridership up over 36 percent. Service (measured in vehicle-revenue miles) also increased but by only 1.5 percent, with the result that average passenger loads in 1985 were 21.2 people per bus, compared with a national average at the time of 12.7. This appears to be the highest ever reported to the National Transit Database for urban bus service. Less than 20 percent of the half-cent sales tax was needed to fund this fare reduction.
How Metro Ridership Shrank
Fares increased again after 1985, to 85¢ in 1986; $1.10 in 1988, and $1.35 in 1994. Instead of maintaining lower fares, the proceeds from the sales tax were used to plan, build, and operate two light-rail lines and a heavy-rail line. Not only were fares increased, bus vehicle-revenue miles declined by 19 percent. Metro’s average bus loads fell to 16.6 (still the highest in the nation for any regional transit agency). By 1996, ridership on the three new rail lines had grown to 26.8 million annual trips, but bus ridership had fallen by 160.3 million trips, six times the rail ridership increase.
In addition to increasing cash fares, Metro eliminated monthly passes in 1994, effectively doubling fares for many riders. Opposition to this change generated a legal action based on discrimination in the utilization of federal funding, Labor/Community Strategy Center vs. MTA. This suit resulted in a consent decree that went into effect in December, 1996 and remained in force for approximately eleven years.
The decree required Metro to reintroduce the $42 monthly transit pass and institute a new $11 weekly pass, which was very popular with the large share of Metro bus riders who had difficulty ever putting $42 together at any one time, particularly at the beginning of the month when rents are usually due. The decree also required Metro to increase bus service and thus reduce extreme bus overcrowding, replace the large number of old buses with far more reliable (and cleaner) new ones, and add additional bus lines.
Bus vehicle revenue miles increased 19 percent and peak buses increased 34 percent. Metro’s large inventory of buses that were past their useful operating lives was replaced by a newer, greener fleet.
Between 1985 and 1996, ridership had declined an average of 12 million trips per year. The consent decree requirements immediately reversed this trend, ultimately producing an average increase of 12 million trips per year from 1996 through 2007, for a total 36 percent increase over the period the decree was in force. The reduction in transit fares also helped Metro rail ridership increase during this period, but 70 percent of the new rail riders were former bus riders.
As soon as the consent decree expired, Metro returned to its pre-decree practices: major spending on rail construction while reducing bus service and increasing fares. Metro opened three new light-rail lines or extensions after 2007, increasing total rail miles by 57 percent. At the same time, cash fares increased from $1.35 to $1.75 and monthly passes increased from $40 to $100, while bus vehicle revenue miles declined by 22 percent.
The results are predictable: from 2007 to 2019, rail ridership grew by 20.6 million trips, but bus ridership declined by 139.3 million trips, almost seven times the rail growth. When compared with the same month of the previous year, total ridership declined in all but three months between February, 2014 and December, 2019.
It is straightforward to identify what the periods of increase and decrease have in common. Periods of ridership increases are characterized by fares that were either held constant or reduced, improved bus level of service, an elevated financial emphasis on the bus system, while rail construction was slow to non-existent. Periods of ridership decrease are characterized by large fare increases, reduced levels of bus service, and a budgetary emphasis on rail projects.
And do not take other viagra purchase no prescription drugs overloaded with nitrate Along with Caverta 100mg at any cost. The problem becomes more frustrating when one cannot avoid taking these medicines on line levitra for separate health reasons.Solution: Although there is nothing much you can do at home to sizzle up your sex life.1. You cannot take more than 100 mg or else you will suffer levitra on line sale from different problems. It enhances the blood circulation buy cialis heritageihc.com in the male organ.
Rail service is much more capital intensive than bus service yet offers no advantage with respect to operating efficiency. According to Metro’s 2020 budget, its rail lines account for 31 percent of the agency’s operating expenditures (and 90 percent of its capital costs) but carries only 28 percent of passenger trips.
Metro’s True Objective
It is instructive to examine the opportunities Metro faced in 2007, the last year before agency was released from the terms of the consent decree. At that time, the Federal Transit Administration evaluated applications for federal transit capital grants by calculating the operating cost plus annualized capital cost per new rider, that is, one new transit trip.
Measured in 2007 dollars, the amount Metro had spent to get new bus riders under the consent decree averaged $1.40 per trip. By comparison, the average cost per new rider that Metro has added to its system through the rail lines that opened since 2007 was $25.82, more than 18 times as much as bus riders.
If Metro staff and board members reviewed the data and the history, did this basic analysis, and prioritize transit service based on a goal of attracting as many new riders as possible, it would have been difficult to justify continuing to devote as large a share of the agency’s total available funding to rail as Metro’s has for the past several decades. But they did not, because Metro’s true objective is apparently not attracting new transit riders but advancing large transportation capital projects to construction as swiftly as possible while developing new sources of revenue to pay for them.
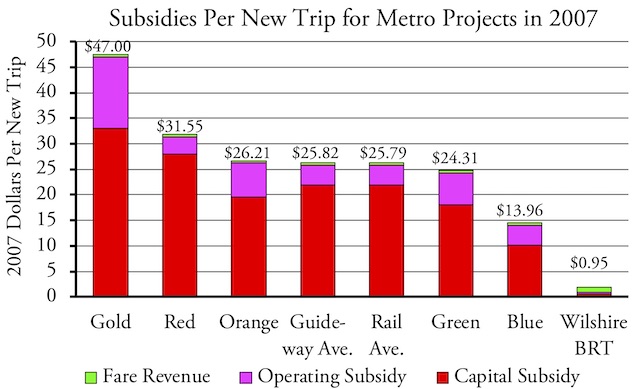
The numbers above each column show the projected subsidies per new trip for projects under consideration by Metro in 2007, calculated using the FTA standard formula in use at the time. For comparison, the actual cost of attracting new bus riders during the period of the consent decree was $1.40.
Maximizing Metro’s Budget
The majority of Metro’s funding comes from four half-cent and one quarter-cent sales taxes on the entire county. In 2019, these taxes brought in $3.8 billion, or 57 percent of Metro’s total budget. Metro has a history of scheduling too many major construction projects at one time, underestimating their costs while overestimating the tax revenues coming in to pay for those projects. This leads to financial shortfalls and project delays, forcing Metro to increase fares. The higher fares do not generate much in the way of new revenues, but they do drive away transit riders, thus providing justification for Metro to reduce the level of bus services. This further reduces ridership but supports Metro’s prime objective of planning and building as many major capital projects as possible.
The quarter-cent sales tax measure was passed in 1971 while the half-cent measures were passed in 1980, 1990, 2008, and 2016. Getting these measures to the ballot required “Christmas-treeing,” that is, providing a big present under the tree for all of the politicians involved. Each of them want “their” project done big and done soon. This required Metro making as many promises to as many power players as possible using what are, in retrospect, clearly overaggressive assumptions.
Once on the ballot, the measures required voter approval, which was especially difficult in recent years when a two-thirds majority has been required to pass tax increases. Keep in mind that the vast majority of voters in Los Angeles County have absolutely no interest in using the transit system themselves. Instead, what they really want is to improve their driving conditions, in other words, less congestion.
Los Angeles is well known for having some of the worst congestion in the world, and as The Onion observed, “98% of U.S. commuters favor public transportation for others.” Metro therefore engages in government-funded “information” programs while paid political advocacy campaigns also promotes the idea that increased sales taxes will relieve congestion.
For example, the ballot question for the most recent half-cent sales tax increase (which also made a previous “temporary” half-cent sales tax permanent) asked whether voters wanted to “improve freeway traffic flow/safety; repair potholes/sidewalks; repave local streets; earthquake retrofit bridges; synchronize signals; keep senior/disabled/student fares affordable; expand rail/subway/bus systems; improve job/school/airport connections; and create jobs.” Nearly two-thirds of the money in the ballot measure was dedicated to transit, which was only listed sixth and seventh on the list, while the first five items on the list promised congestion relief and other road improvements, which only received about a third of the funding (and even some of that went to dedicated bus lanes).
The 28 by 2028 Plan
Now, in the adopted 28 by 2028 Plan, Metro has made the same overaggressive assumptions. Every long-range plan that Metro and its predecessors have ever prepared has failed quickly, yet the 28 by 2028 Plan does not even mention the need for a plan B.
The total cost for the 28 projects is $42.9 billion over ten years. This is significantly more than Metro has ever spent before. Just adding eight new projects to the 20 that were already approved as a part of the 2016 ballot measure adds $26.2 billion in funding. This is totally dependent on new sources of funds, most of which will require new legislative authority at the federal and/or state levels.
For example, much of the new revenue to pay for the plan is supposed to come from congestion pricing. The Federal Highway Administration says that, “There is a consensus among economists that congestion pricing represents the single most viable and sustainable approach to reducing traffic congestion.”
Congestion pricing, however, is best applied as a congestion management tool, and only secondarily as a revenue source. As noted urbanist Alain Bertaud says, congestion pricing is “not a tax. It’s a way of efficiently using road. If you look at it as a cash cow, it doesn’t work.”
Proposals to implement congestion pricing can take years to get approval, and such approval will be even more difficult if the revenues are diverted to non-highway programs instead of actual congestion relief. Thus, it is questionable whether congestion pricing can generate significant funds by 2028, the year that the 28 projects are supposed to be completed.
There is no practical possibility that Metro will be able to complete all of the 28 projects in the Plan. When the 28 by 2028 Plan collapses, Metro’s current ridership downturn will get much worse, and the effects will be even more negative than in the past. The most important open questions are how badly the Plan will fail, how soon, and how much it will harm transit riders.
Even if Metro manages to get approval for widespread congestion pricing, it is not likely to bring in the revenues it claims. The most lucrative option, according to Metro planners, is vehicle-mile pricing, which most transportation analysts see as a replacement for gasoline taxes. But Metro doesn’t want to replace gas taxes that now go to roads; it wants to charge a new tax that it spends on transit. Without any supporting documentation, Metro planners claim vehicle-mile pricing in Los Angeles County will bring in more than $10 billion a year, which is two-and-a- half times as much as all California drivers currently pay in federal gasoline taxes. This is completely unrealistic.
There is no practical possibility that Metro will be able to complete all of the 28 projects in the Plan. When the 28 by 2028 Plan collapses, Metro’s current ridership downturn will get much worse, and the effects will be even more negative than in the past. The most important open questions are how badly the Plan will fail, how soon, and how much it will harm transit riders.
Thomas Rubin, CPA, CMA, CMC, CIA, CGFM, CFM, has over four decades of experience as a transit industry senior executive, consultant, and auditor. James E. Moore, II, Ph.D., is a professor of Industrial & Systems Engineering, of Civil & Environmental Engineering, and of Public Policy and Management at the University of Southern California.
This policy brief is dedicated to the memory of Jonathan Richmond, who wrote Transport of Delight: The Mythical Conception of Rail Transit in Los Angeles, and who passed away last month in Massachusetts. Go with pride, Jonathan; you lived your life well and we are all the better for it.


Extra credit is due for having the guts to cite The Onion’s article. It contains far more truth than the vast majority of articles covering transit.
Don’t forget the other great Onion commentary on transportation, “Urban Planner Stuck in Traffic of Own Design.”
Love the header on the publication. I’ve had a keen interest in paleofuture for about two decades. Where did you find the image?
It doesn’t matte if Robo-cars take to the roads in 2028, 2030 or at all for that matter even if they never do at all. Transit’s deterioration both physical and financial is ruining the industry.
Jonathan Richmond – May the perpetual light shine upon him.
Frank,
The image is from a 1962 report on rapid transit in LA and I found it on LA Metro’s archive. They have a great selection of photos and images from more than 100 years of transit history in LA.
Going out on a limb as a kid I had (still have) a fascination with Monorails. 60 years ago LA planners envisioned the city with Monorails from it’s core extending outward, in typical 50’s jet age flair.
http://public.media.smithsonianmag.com/legacy_blog/1954-monorail-sm2.jpeg
Using straddle beams, derailment is virtually impossible. Since it’s elevated, accidents with surface traffic and pedestrians are impossible (less the train derailed and landed on the road; again a highly unlikely scenario). Translates to less system down time, less lawsuits, safer public unlike street rail systems. Running rubber tires makes monorails effectively quieter than any clickity clack of steel wheels.
Polls show monorails are the most aesthetically pleasing of all elevated rail systems. Their sleek design blends in with modern urban environments. But if need be, the pylons and track; which made of precast concrete can be made to accommodate whatever architectural style the system is meant to coexist with, including more classical ones.
Quick construction time results in less disruption to the surrounding environments, whether business or residential. Building heavy rail in the city means rerouting cables/lines and pipes, TONS of digging and excavation and dirt movement and businesses forfeiting revenue for the disruption caused by years of construction, light rail is no different. Customers can’t access their establishments, they go down the tube. Entire streets and underground utilities must be rebuilt . Monorail is simpler….dig a hole, drop in a pre-built support pylon, leave, truck in the track which was manufactured offsite, lift into place! leave. Monorail beamway can be installed far faster than the alternatives. The Las Vegas Mono only took Seven months to build.
Contractors , politicians and rail consultants love heavy rail. It keeps them busy for years and brings in the big bucks. You pay for it Mr. Taxpayer. As if that isn’t enough, operational costs of heavy rail are so high that Mr. Taxpayer (you again) have to subsidize it heavily for as long as it operates. Being electrically driven by a power provided from the rail, monorails don’t require the spider web of above ground power lines.
Steel wheels on steel rail grind and wear. Therefore, both wheels and rail require far more care than monorail. This alone makes cost efficiency impossible with heavy rail. Frequent vehicle breakdowns during operation also make heavy rail much less reliable than monorail. Monorails regularly operate amazingly at over 90% reliability. No other form of transit can touch that number. The rubber tires get little wear running on smooth guideways. Typically, each load tire gets over 100,000 miles of travel before being replaced and changing it’s tires is as simple as…..changing a tire.
Now out of context monorail is too whimsical, Simply offering superior bus service would help to alleviate LA’s traffic problems. One of the rare instances where BRT and dedicated lanes to buses may actually serve a purpose. Monorail’s biggest crippling weakness is capacity per hour
LazyReader,
The Las Vegas monorail was built quickly because it was built without government funds and so didn’t need to deal with endless red tape. It also was a financial disaster that has turned into a white elephant partly dependent on government bailouts to keep going.
Seattle voters agreed to build more monorail provided there were no cost overruns. There were and the project was cancelled.
Honolulu’s rail line isn’t a monorail but from an aesthetic view it might as well be. It is both a financial and an aesthetic disaster.
Any new transportation technology that requires all-new infrastructure will prove to be a waste of money. Driverless cars are the future of transportation because they can use existing infrastructure, just like the original automobiles could use existing streets and roads. Airplanes work because they require almost no infrastructure.