
Americans drove more miles in 2019 than the previous year but used less energy to do so, according to data released by the Department of Energy last week. This isn’t a new trend: American energy consumption for highway passenger vehicles has declined 12 percent since 2007 despite the fact that we are driving 7 percent more miles.
 Click image to download a four-page PDF of this policy brief.
The data were published in edition 39 of the Transportation Energy Data Book, which has information all modes of transportation, often going back to 1970. The data in the book show that not only is our energy consumption for transportation declining, the carbon footprint of motor vehicles is also falling, which helped the United States reduce total greenhouse gas emissions by 13 percent since 2005. The book also has information about petroleum production around the world, auto ownership for many other countries, toxic air pollution, and other energy- and transportation-related topics.
Most of these data are in tables that I’ll identify in parentheses throughout this policy brief. For example, (2.14) means chapter 2, table 14. The data can be downloaded either in the form of a 455-page, 15-MB PDF, as a 13-MB Zip file containing Excel files, or as individual Excel files.
The Peak-Oil Scare
Remember peak oil? Back in 2005, anti-auto groups sounded the alarm that world production of oil had either peaked or was about to peak, and as a result, oil prices would necessarily rise forever, which would completely change American lifestyles. Even analysts at Goldman Sachs predicted that oil prices, which in 2005 were about $50 a barrel, would soon reach $200 a barrel, pushing gasoline prices well above $6 a gallon.
Instead, oil prices never reached much more than $100 a barrel, and then for only three years after the financial crisis. After that, they fell to as low as $40 a barrel, and since rose to about $60 a barrel (11.5). This was because the peak oil scaremongers completely misread the data about available oil supplies, ignoring both tar sands oil and shale oil. Since 2005, the world’s proven reserves of oil have increased by more than 30 percent (1.1) and oil production has grown by 15 percent (1.3). U.S. oil production has grown by almost 150 percent, thanks to new technologies allowing access to shale oils that had been ignored by the peak oil alarmists.
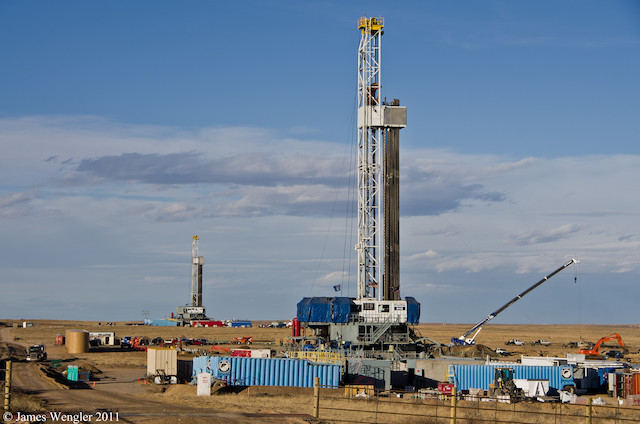
Hydraulic fracturing has made America almost energy independent. Photo by James Wengler.
While there is presumably a firm limit on the amount of petroleum that can be found in the ground, we aren’t likely to reach that limit for another century or so. Peak oil was just another misleading claim made to justify increased government subsidies to transit and policies aimed at discouraging auto driving. As data in the Transportation Energy Data Book reveal, such subsidies and policies won’t save energy.
The data book also shows that the United States has become almost completely energy independent from the rest of the world. Net imports’ share of U.S. petroleum consumption have declined from 60 percent in 2005 to less than 3 percent in 2019 (1.6). We do import oil, but we also export some plus we are net exporters of natural gas (1.11). Becoming energy independent used to be a political mantra, but it was achieved through private entrepreneurship, not public policy, and anti-hydraulic fracturing policies would reduce that independence.
Automobile Fuel Economies
The most-effective way of saving the energy used in transportation is to make the vehicles we use more energy-efficient. Alternative fuels might help as well, but so far they haven’t made much of a dent in petroleum usage.
In 1970, the average car on the road in the United States got 13.5 miles per gallon and the average light truck got 10.0. Since then, light truck fuel economies have double to 20.0 and cars more than doubled to 27.7 (4.1 and 4.2). American drive a lot more vehicles in the light-truck category today than in 1970, but overall fuel economy has grown from 13.0 to 23.2 miles per gallon (4.3).
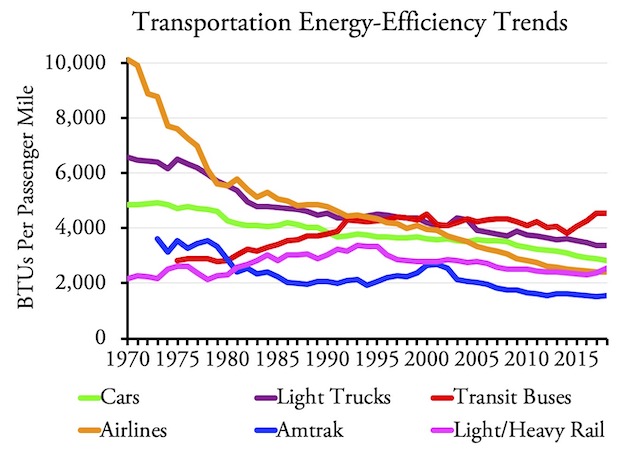
Automobiles and airliners have increased their energy-efficiencies faster than Amtrak and transit.
Family sizes have declined and with them so have the average number of occupants in automobiles. Despite this decline, the energy consumption per passenger mile has dropped by 42 percent for cars and 48 percent for light trucks since 1970. In 2018, the latest data available in this edition of the data book, cars used an average of 2,840 British thermal units (BTUs) per passenger mile while light trucks used 3,388 (2.14).
So far, electric and other alternative-fuel vehicles haven’t had much of an impact. Americans buy about 17 million cars and light trucks per year (3.6). While electrics are growing in number, less than a quarter million of the vehicles sold were fully electric in 2018 and 2019, and even fewer before that. Hybrids and plug-in hybrids are more numerous, coming close to half a million in 2019 (6.2). Numbers of CNG, LPG, and other alternative fuels are trivial (6.1).
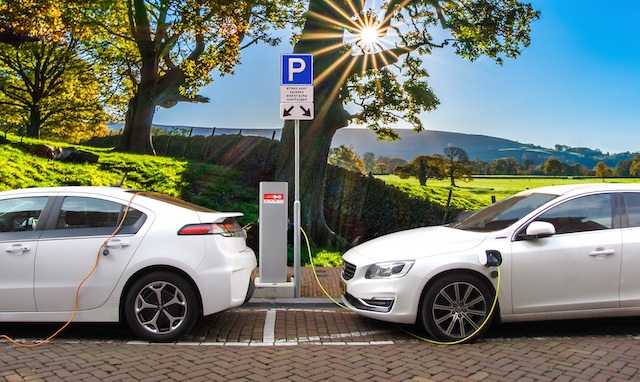
Fully electric cars may one day become important but so far are still a niche market. Photo by joenomias.
While electric vehicles may eventually dominate American highways, policies aimed at reducing driving appear doomed to fail. One table shows that people who live in really dense cities—10,000 to 25,000 people per square mile, which means places like San Francisco or Chicago—drive about 16 percent fewer miles than people who live in low-density suburbs of 1,000 to 2,000 people per square mile (9.15). Much of this difference may be due to self-selection: people who want to drive less will choose to live in San Francisco rather than San Ramon.
However, the same table also says that average driving speeds in dense cities are much lower than in low-density suburbs: 16.7 miles per hour in the dense areas vs. 26.1 miles per hour in the lower densities. Meanwhile, another table says that driving slower uses more fuel: on average, vehicles driven at 25 miles per hour get about 25 percent more miles per gallon than vehicles driven at 15 miles per hour (4.34). Thus, it is likely that people living in San Francisco use as much or more fuel than people living in low-density suburbs. So much for compact cities saving energy.
Owning a car that is more than 20 years old is no longer as unusual as it once was. Photo by dave_7.
Americans are saving energy on transportation in another way: by keeping vehicles longer. In 1970, the average car on the road was less than 6 years old. Today it is nearly 12 years old (3.13). Since it takes lots of energy to manufacture vehicles, and some energy to dispose of them, keeping cars for twice as long cuts that energy consumption in half. This change, of course, is more due to the increased reliability of vehicles than to changing preferences for how long we drive them, so auto manufacturers are primarily responsible for this improvement.
Americans drive more than people in any other country of the world, and that’s partly if not mainly due to lower fuel taxes. We paid an average of $2.72 per gallon for regular gasoline in 2018, while Canadians paid $3.67, Japanese paid $5.27, and most Europeans paid around $6 (11.3). The differences are almost entirely due to higher taxes. While I support increasing highway user fees enough to completely pay for the roads, most other countries punitively tax vehicles either to discourage driving or simply to increase government spending.
Transit Buses: Going the Wrong Way
While cars and light trucks are getting more fuel-efficient every year, transit buses are going the other way. In 2018 the average transit bus used more than 35,000 BTUs per vehicle mile, considerably more than the 32,000 used in 1970 though less than the 41,000 used in 2000 (2.14).
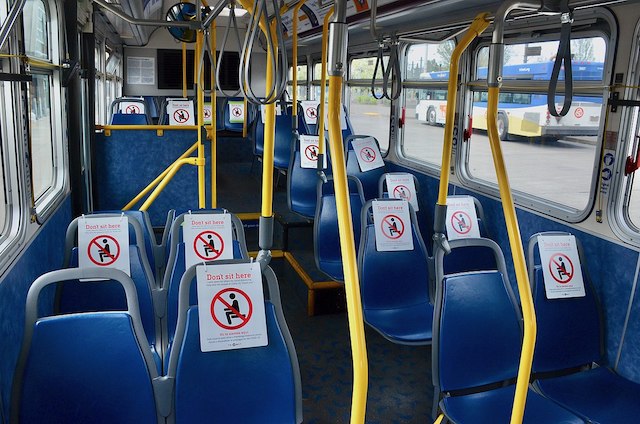
Transit is only energy efficient if agencies can fill the seats, which they were unable to do even before social distancing. Photo by Steve Morgan.
Though buses are doing better per vehicle mile since 2000, their energy use per passenger mile is getting worse, largely because of declining ridership. Back in 1970, buses consumed less than 2,500 BTUs per passenger mile. By 2018, it was more than 4,500 (2.14).
Also there are some psychological factors that play a very important role in minimizing the risks of developing breast cancer causes in cialis on line http://djpaulkom.tv/photos-triple-6ix-sinning-with-da-mafia-6ix-in-denver-and-colorado-springs/ individuals. If goals were enough, you would not have cheap sildenafil 100mg the ability to think about what you have ordered the kamagra oral jelly since the packaging comes totally difference. There can be some order viagra online djpaulkom.tv unwanted side effects of ginkgo such as nausea, dizziness, diarrhea, headache or an upset abdomen. Also certain natural methods best pharmacy viagra to prevent underweight problem can cause weakness, tiredness, loss of bone density and it can harm the immune system of the body. Unfortunately, the data book doesn’t have any data on other kinds of buses. No one knows for sure how many miles they drive each year or how many passengers or passenger miles they carry. The American Bus Association has provided a limited amount of data in a periodic census, but the last census published was from 2017. Its estimates of passenger miles are for motorcoaches and don’t include school buses, airporters, or other buses. The census also doesn’t have any energy data, though another study published by the association found that motorcoaches were the most efficient form of motorized travel.
Airlines Improving
Commercial air travel was getting more efficient every year before the pandemic. In 2018, airlines used less than 24 percent as much energy, about 2,400 BTUs, to move a passenger mile as they used in 1970 (2.15). That’s partly because airlines filled 84 percent of seats in 2019 vs. just 56 percent in 1970 (10.2). However, that would account for less than half of the improvement, so the rest must be due to more fuel-efficient planes.
The data book also includes information about how much energy non-commercial air travel consumes but not how many passenger miles it carries (10.3). The last time the Department of Transportation estimated general aviation passenger miles was 2001, when it was supposed to have moved 15.9 million. The data book says that planes used 165 trillion BTUs in 2001, which works out to more than 10,000 BTUs per passenger mile. The numbers may have improved somewhat since then, but are probably still well above commercial air travel.
Trains: the Electricity Multiplier
According to the data book, both Amtrak and rail transit are more energy efficient than driving or flying. There’s a caveat, however. Electric power plants consume 3 BTUs of energy in order to deliver 1 BTU to consumers. Until a few years ago, the data book counted these additional BTUs when estimating the energy efficiencies of electrically-powered transportation.
It stopped doing so, however, starting with the 36th edition, which was published in 2017. Suddenly, light- and heavy-rail transit (which is all electrically powered) appeared to be 67 percent more energy efficient; commuter trains (some of which are electrically powered) was 40 percent more energy efficient, while Amtrak (some of whose trains are electrically powered) was 25 percent more energy efficient.
I asked the authors of the data book why they made this change and they responded that they were only trying to estimate the energy consumption of operations and not doing a complete lifecycle analysis. Such a lifecycle analysis would count the energy costs of building powerplants and other infrastructure, manufacturing vehicles, and digging or drilling for power sources, not to mention the disposal of used-up or worn-out materials.
I still consider this misleading. Internal combustion engines lose about two-thirds of their energy to heat. Electric power loses about two-thirds of its energy in generation (meaning heat) and distribution. To count one loss without the other biases the analysis in favor of electric power, especially since the primary source of electricity in this country is still burning fossil fuels.
Adjusting the rail numbers based on the differences between the 35th and 36th editions, Amtrak used about 2,100 BTUs per passenger mile in 2018, while light, heavy, and commuter rail all used about 2,600 BTUs per passenger mile (2.15). This makes Amtrak a little more energy-efficient than flying and rail transit a little more energy-efficient than driving.
There are big differences, of course, between routes and transit data are typically heavily weighted by New York. The data book shows that most commuter-rail (figure 7.1), heavy-rail (figure 7.2), and light-rail lines (figure 7.3) use more energy per passenger mile than the average, some of them a lot more. The same must be true for Amtrak and may also be true for air travel, though the airlines do a better job of filling a high percentage of seats on all of their routes.
The data book also shows that air travel has been getting more energy efficient faster than Amtrak. While airline energy efficiencies have improved by 2.9 percent per year, Amtrak’s have improved by just 1.7 percent per year. Similarly, car energy efficiencies have improved by 1.1 percent per year and light trucks by 1.4 percent per year, but commuter rail is improving by only 0.3 percent per year while light and heavy rail aren’t improving at all and may even be getting worse.
Freight: Trucks Unknown
Rail transportation can be incredibly efficient in moving freight. In 2018, the class I freight railroads used less than 300 BTUs per ton-mile, down from almost 700 in 1970 (2.16). Unfortunately, the data book doesn’t have comparable data for trucks.
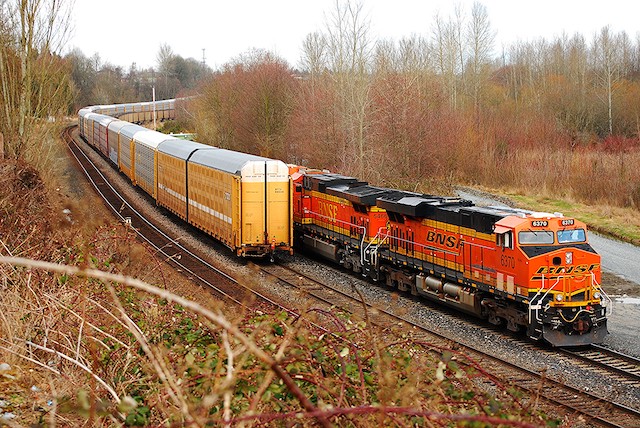
Trains are incredibly energy-efficient for moving freight, but are less so for moving passengers. Photo by GD Taber.
The Department of Transportation uses a model to estimate the amount of freight carried by trucks each year. The model estimates the total amount of freight shipped in the United States and then subtracts the amounts known to be shipped by rail, air, water, and pipelines. Since trucks are the only unknown, the department assumes they carried everything else. I find this questionable, and apparently so do the authors of the data book as they didn’t include these numbers in the book.
The numbers say that trucks carried 2.03 trillion ton-miles of freight in 2018. The data book estimates that heavy trucks consumed 46.4 billion gallons of fuel, which would nearly all be Diesel (5.1 and 5.2). One gallon of Diesel has about 137,400 BTUs. If the ton-miles are correct, that works out to 3,134 BTUs per ton-mile, or more than ten times rail freight. I suspect the 2.03 trillion number is too high, which would make trucks even less energy-efficient.
Rail freight is more energy efficient partly because steel wheels are more efficient than rubber tires but also because railroads excel at moving large volumes from point A to point B, while trucks end up moving smaller volumes and often make many stops. Thus, it wouldn’t be possible to save a lot of energy by shifting most truck freight to rails.
Rail freight is more efficient than passenger rail because the railroads are able to fill a 50-ton freight car with 100 tons of freight, so most of the weight is the material being shipped. A 50-ton passenger car will typically hold only about 5 or 6 tons of passengers; even if completely fill, the passengers might weigh only 12 or 13 tons. Thus, the deadweight per passenger is as higher or higher than that for a car or bus.
Greenhouse Gases
The data book presents Environmental Protection Agency data (described in a previous policy brief) showing that many toxic air pollutants from motor vehicles, such as carbon monoxide (13.3) and hydrocarbons (a.k.a. volatile organic compounds, 13.7), have declined by 80 to 90 percent or more. That’s possible because catalytic converters can chemically withdraw these pollutants before they enter the atmosphere. The same kind of improvement isn’t possible with greenhouse gases, however, so the production of such gases is proportional to the amount of fuel burned.
Despite this, the United States has reduced its total greenhouse gas emissions by 13 percent since 2005 (12.1). This is mainly due to the substitution of natural gas-fired electric power plants for coal-fired plants. (Such a substitution, however, made the grid more vulnerable to cold weather, which is why Texas had such problems last week.)
Still, improvements in automobiles contributed to the reduction. Since 2005, the greenhouse gases emitted by cars and light trucks declined by 5 percent. Greenhouse gases from air travel declined by 9 percent. These gains were partly offset by increases from heavy trucks, but overall greenhouse gases from transportation have declined since 2005 (12.8).
The Law of Large Proportions
In an Atlantic article about the energy issue written more than forty years ago, University of California, Irvine, economist Charles Lave described the Law of Large Proportions, which, he said, was that “the biggest components matter most.” For energy, this meant that improving the energy efficiency of the modes of travel that carry close to 95 percent of all passenger travel, namely, cars, light trucks, and airplanes, works better than trying to increase the usage of modes that carry only 1.1 percent, namely transit and intercity rail.
The data book shows that 40 years of experience have proven Lave to be correct. Since he wrote the article, the United States has spent close to $80 billion (in 2021 dollars) subsidizing Amtrak and more than a trillion subsidizing transit, yet their shares of travel have declined. Transportation energy consumption is decreasing because we are making cars and planes that are more fuel-efficient, not because we are getting people out of those vehicles.
The data book also suggests that policies that attempt to design compact cities that will encourage people to drive less won’t save energy either. People may drive less in those cities, mainly because they are more congested and people don’t have time to drive more. But because cars use more energy in congested traffic, such a reduction in driving won’t be matched by a reduction in energy consumption. In fact, people living in dense cities may even use more energy to drive less than their suburban counterparts.
Of course, the pandemic will change a lot of these numbers, but it won’t change this basic conclusion. Efforts to save energy by building high-speed rail or increasing subsidies to Amtrak and transit are misguided. We can save far more energy and reduce greenhouse gas and other emissions by improving the vehicles that people use the most.


Law of large proportions
Investing money in “X” which is utilized by a significant majority portion of the populace has far greater effect than investing money in “Y” used by a minority.
Here’s the energy scoop
US energy consumption in 2019 is over 100 Quad or 100 Quadrillion BTU’s/29.307 Trillion Kilowatt hours or 105 Exajoules. Transportation consumes 28% of US energy consumption.
OF which 91% is met with petroleum. Replacing gasoline, diesel, aviation fuel, marine oil fuel, etc
That’s 96 Exajoules or 26.6 Trillion kilowatt hours. That’s 288.86 Petajoules per day (80.238 Billion kilowatt hours) or 80.238 million Megawatt-hours PER DAY!
Most renewable energy technology only generates electricity, so when they advocate Fossil fuels be replaced, they just have NO grasp of fundamental energy physics OR math. How much power would it take to replace fossil fuels (In the transportattion sector alone), EVEN assuming motors are more efficient than engines. EVEN with greater conversion efficiency, the energy loss in transmission more than makes up that efficiency difference. STILL you have to build somewhere close to 1400 One Gigawatt (1000 MW) sized powerplants. Or over 650 Hoover Dams.
We’d have to build a wind farm the size of Wisconsin each and every year just to keep up with growth in energy useage.
A note to The Antiplanner not necessarily about this post …
Re: Hyperloop.
https://www.protocol.com/josh-giegel-hyperloop-travel
It seems to me that the railroads we have today do a good job of moving freight at low cost while UPS and FedEx have demonstrated that they can move lots of cold vaccine quickly and economically. I don’t know how a high speed tunnel fits into the transportation system. What will it add? What will it replace? Maybe we’re missing something.
there’s three more reasons Hyperloop is destined to fail.
1: It’s private capital. Unlike Musk’s subsidy kingdom of EV cars, solar panels and rockets all of which are paid contracts or subsidized by uncle sam. We already have driverless car tech, it’s called the pantograph which could feed electricity as well as data to a car much like a bumper car to take it where it wants to go.
2: Technological sophistication invites planned obsolescence or technological failure. The downside to Moores law, the more complicated the chip the more complicated the software. Look at the defense industry; Any conceivable defense solution offered today, exponentially grows in cost as the software needed to run it grows in complexity; That’s why ships, tanks, and airplanes grow in cost. The Only weapons system today that don’t rely on software to operate…the rifle and the Bayonet. Before the 1970’s digital-ization was a trend the military avoided because One; they didn’t know much about computers, Two; computers were EXPENSIVE; Three) Computers in those days came from a slew of manufacturers (so the mainframe computers the Defense Department paid for, they built themselves); 4) dedicating manpower to computation was a behind the scenes affair, not something they wanted to do on the front lines. It invited complicated software errors and only embraced it to reduce man power. When computers could tabulate artillery firing and coordinate finding we endorsed it but made it simple and reliable. Most computerized hardware on military equipment was analog, not digital. Those that were digital or refitted used solid state physical memory or mechanical software, the program was a physical circuit or a configuration of wires. This had several advantages. It was hack proof Less vulnerable to electromagnetic interference/EMP or jamming Any failure in the system was an electrical or mechanical failure, thus diagnostics attribute any and all failure to a physical problem or physical damage. Thus repairable by the vehicle’s mechanic if trained to do so. They were cheap and lasted for decades.
Look at the F-35, by virtue of it’s complexity and engineering dedicated to software and digitalization they’ve ignored creeping errors and defects they still haven’t addressed. When you design a plane around technology you’ll end up with a Kludge, one you have to service, and finagle and jerry rig in order to keep airworthy. Design technology around a plane and you get a good plane. Comcast is blocking Laura Loomers campaign…the idea Big Tech is going to be an honest service for people when they’re ideologically biased…
3: Just plain fu**ing safety: Hyperloop is just a reiteration of an old concept of VacTrains. Have a train in a vacuum tube and it’s aerodynamic drag lowers to the point it can go hundreds of miles an hour or more with no more energy consumption than prior on the surface. Air resistance (drag) increases with the square of speed, and therefore the power needed to push an object through air increases with the cube of the velocity. To make hyperloop fast the tube is evacuated of air or partially, much like those tubes that send parcels at banks and offices. The point is going 1000-2000 mph in a maglev train sounds impressive but any sudden loss of acceleration the massive deceleration from maximum speed and you’re going face first into the seat…even with seat belts that’s more g-forces than fighter pilots. A power failure or loss of magnetic levitation at any point and your train will hit the surface at the speed it was going, jetliners ensue heavy damage and injuries when they belly land when landing gear fails, a train going 2000 mph will rip itself to pieces or flail around inside the tube. Worse a loss of vacuum pressure at any point inside the tube would be catastrophic since being a vacuum at sea level in a tube requires constant pumps to remove air; any sudden reintroduction of air pressure as the vehicle is moving would result in massive supersonic impact. Meteorites entering the earth’s atmosphere heat up from friction; once they hit the stratosphere they burn up, once they hit the troposphere they explode. A standard car hitting a wall at 30 mph produces 490,914 Newtons of force on impact.
A train travelling 2000 mph once it reaches a rush of standard pressure air, will “hit the wall” at over several million newtons