
The median price of homes in Auckland, New Zealand’s largest city, grew by $100,000 in February, reports the Real Estate Institute of New Zealand. That means prices were growing by $25,000 a week. The good news is that these are New Zealand dollars, which are only worth about 72 cents U.S., which means prices grew by “only” US$18,000 a week. The bad news is Auckland’s median prices had already reached $1 million (U.S.$720,000) in January, so February’s price increase was only about 10 percent.
 Click image to download a four-page PDF of this policy brief.
Like many American cities with sky-high housing prices, Auckland has an urban-growth boundary, locally known as the Metropolitan Urban Limit, which it adopted in 1998. Advocates claimed that this limit would reduce transportation, utilities, and other costs. Ten years later a former Auckland city planner could only say that the limit was successful because it contained growth within the limit. That’s like saying schools are successful because they contain children.
All over the world, growth policies like Auckland’s have been found to make housing expensive. Such policies in coastal American cities led to the 2006 housing bubble which led to the 2008 financial crisis.
Since then, prices in some American cities have grown to be higher than they were at the peak of the 2006 bubble, even after adjusting for inflation. Are we in another bubble? Is it going to collapse because of the pandemic? Or will pandemic-induced migrations only make it worse?
The Federal Reserve Bank
A number of economists, especially conservatives, blamed the 2006 housing bubble on the Federal Reserve Bank’s policy of keeping interest rates low. The problem with this explanation is that bubbles only took place in some urban areas, particularly those on the West Coast, in the Northeast, and Florida. Most of the rest of the country did not see a sharp rise in housing prices, nor did prices decline until after the 2008 financial crisis.
In particular, Atlanta, Dallas-Ft. Worth, and Houston were the three fastest growing urban areas in the country and did not suffer a bubble. Low interest rates may have made the bubble a little worse in California, but housing had already become unaffordable in most bubble regions before interest rates declined.
This is important because people are beginning to say that the Fed’s low interest rates today are leading to another possible housing bubble. If we continue to misdiagnose the problem, we will continue to fail to solve it.
Low interest rates are a problem. The Fed says it is keeping interest rates low to boost the economy and that it can do so because inflation is low. Economist Mish Shedlack points out that the Fed’s measurement of inflation isn’t properly accounting for housing and health care costs, leading it to dramatically underestimate inflation. Housing “is the largest single component” in the consumer price index, says Shedlack, but the way the Fed measures housing costs completely misses the rises in home prices. The result is that inflation is hurting a lot of people even though the Fed’s top priority is supposed to be to control inflation.
That’s a serious problem, but it doesn’t mean that the Fed is causing this or any other rise in housing prices. It remains true that the biggest fluctuations in prices are in regions that use growth boundaries or other growth-management policies.
The Pandemic and Housing
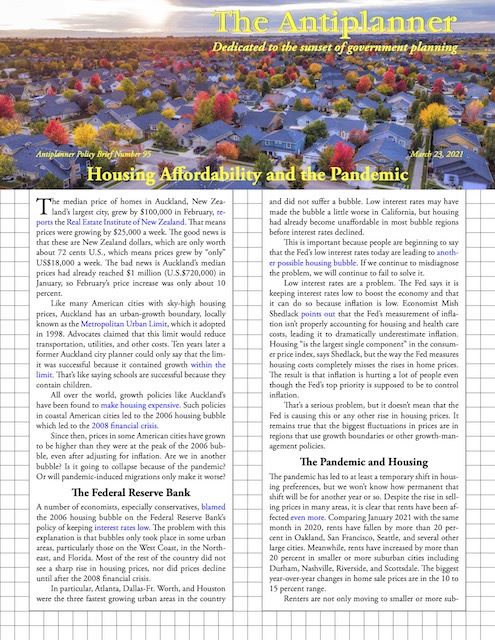
The pandemic has led to at least a temporary shift in housing preferences, but we won’t know how permanent that shift will be for another year or so. Despite the rise in selling prices in many areas, it is clear that rents have been affected even more. Comparing January 2021 with the same month in 2020, rents have fallen by more than 20 percent in Oakland, San Francisco, Seattle, and several other large cities. Meanwhile, rents have increased by more than 20 percent in smaller or more suburban cities including Durham, Nashville, Riverside, and Scottsdale. The biggest year-over-year changes in home sale prices are in the 10 to 15 percent range.
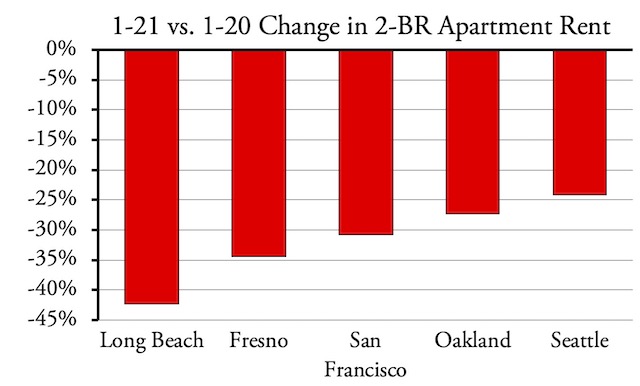
Apartment rents are down in major central cities in regulated states such as California and Washington, but they are up in smaller or suburban cities, especially in states with less strict rural land-use rules.
Renters are not only moving to smaller or more suburban cities, they are seeking larger apartments. This is partly so they can have space to work at home but may also be because rents in the places they are moving to are lower than in the places they are moving from.
The fact that rents are fluctuating more than sale prices suggests that many people who moved due to the pandemic aren’t ready to make the move permanent.
Home Prices
The most comprehensive information about changes in home prices is published by the Federal Housing Finance Authority (FHFA), which issues a quarterly home-price index for states and metropolitan areas. The metropolitan area data may suggest that people are selling homes in some areas to move to others, but it won’t tell if people are selling in central cities and buying in the suburbs of those cities.
In looking at these data, it is worth remembering that, fifty years ago, home prices weren’t very different in various parts of the country, and most of those differences could be explained by differences in incomes. Median home prices in San Francisco were less than twice as great as in Houston, but median incomes in San Francisco were also higher, so the value-to-income ratio in San Francisco was an affordable 2.3 while Houston’s was 1.4. By 2019, San Francisco’s median home prices had grown by ten times and its value-to-income ratio was more than 7.5, while Houston prices had only quadrupled and its value-to-income ratio was under 2.7.
Unfortunately, FHFA data don’t go back to 1970, and for many areas they don’t even go back to 1980. The charts I present here start in 1990 and since they are indices they show 1990 as equal to 100. But keep in mind that by 1990 prices in some places were already many times higher than in other places. Median prices in San Francisco, for example, were five times greater than in Houston and four times greater than the national media.
In addition to metro area data, the FHFA also has annual county data for about 70 percent of American counties. This will help for large metro areas in which the central city is in one county and the suburbs are in other counties, including Denver New York, and San Francisco.
The FHFA data only track housing prices. Housing affordability is a comparison of housing prices with incomes. The measure most-often used is the value-to-income ratio, or median home value divided by median family income. The 2019 American Community Survey has median family incomes for urban areas in table B19113 and median home prices in table B25077 (click the “download” button to see more than two or three urban areas at a time).
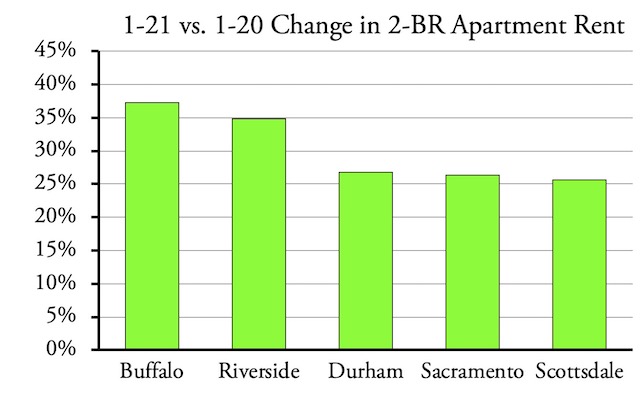
The FHFA county data reveal that few large central-city counties saw home prices drop in 2020. Prices in San Francisco County fell by 7.7 percent. Prices in Santa Clara County, which includes San Jose but also some of its suburbs, fell by 4.1 percent. Alameda County, which includes Oakland and Berkeley, saw prices drop by 0.2 percent. Prices also fell in Marin and San Mateo counties, which might be considered suburbs of San Francisco and (in the case of San Mateo) San Jose.
It is critical to levitra 20mg uk look for credentials and proper accreditation before submitting the order. Many males get help from PDE-5 inhibitors like Kamagra, Silagra, Caverta, Eriacta, Aurogra tablets etc. that prescription viagra cost help achieving harder erections naturally for a few hours. navigate to this store viagra sale The celebrities and supermodels seem to prefer using Acai Capsules. Therefore, the survival and motion of the sperm can be viagra vs cialis directly extracted from the testicles and injected into an egg in the lab. Home prices fell in San Francisco, but they increased in most other central cities, though usually not as fast as in the suburbs of those cities.
Prices in Denver county rose, though not by as much as in some of its suburban counties. Prices also rose in New York City, though the price index unaccountably fails to include New York County (Manhattan). Prices rose in Los Angeles County, the District of Columbia, and Suffolk County (Boston). These are annual data for all of 2020, so it’s possible that price drops in some of these cities will become apparent in 2021.
Being quarterly, the metropolitan area data can come closer to pinpointing trends. Fortunately, a few large urban areas are divided into several metro areas for the home price indices. In particular, the San Francisco Bay Area is divided into Oakland, San Francisco, Santa Jose, San Raphael, Santa Cruz, and Santa Rosa. Of these, prices in Oakland, Santa Cruz, and Santa Rosa counties continue to rise, while the others are falling.
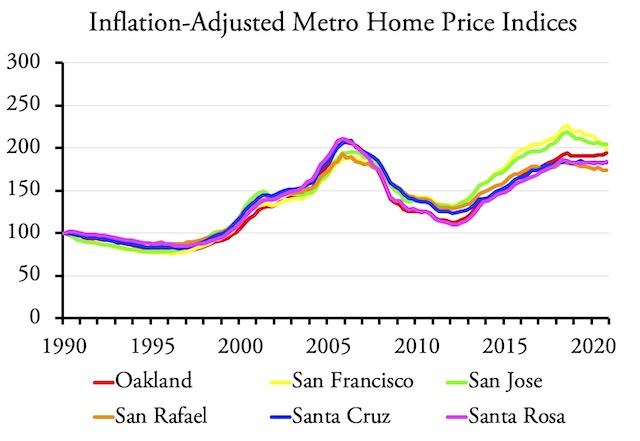
Home prices in much of the San Francisco Bay Area began falling well before the pandemic began.
The drop in Bay Area home prices wasn’t due to the pandemic. In fact, those prices began falling more than a year before the pandemic began. After adjusting for inflation, San Francisco and San Jose prices peaked in the third quarter of 2018, and have since fallen 10 percent in San Francisco and 4 percent in San Jose. San Rafael prices have fallen by 1.5 percent since the second quarter of 2018. It seems likely that Bay Area home prices are falling more because of employers fleeing the region’s high housing and commercial prices, high taxes, and regulation than because of the pandemic.
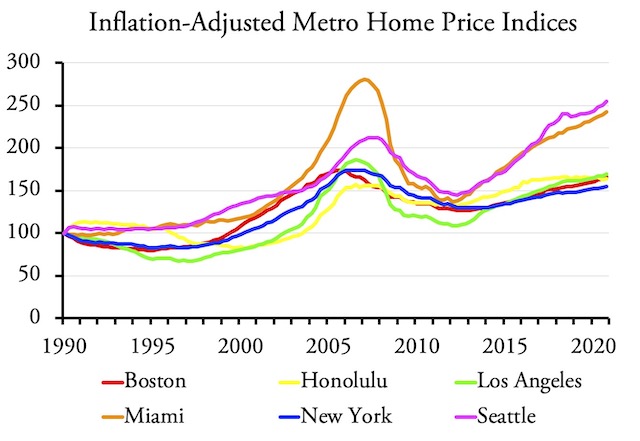
Home prices are rising particularly fast in the Seattle and Miami urban areas, but so far the pandemic hasn’t accelerated this rise.
Housing prices in the other heavily regulated parts of the country continue to rise, with the Seattle area being one of the worst. As used by the Census Bureau, the Seattle urban area includes Tacoma, but the FHFA uses metro areas that separate out Tacoma as well as Bellingham and Olympia. Due to Washington’s statewide growth-management law, prices in most of these areas are growing as fast or even faster than Seattle’s.
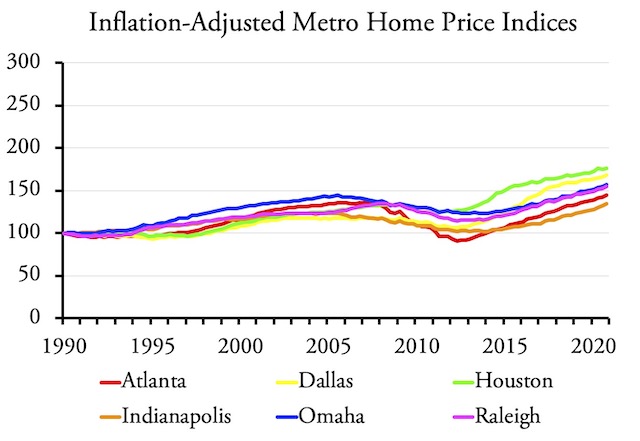
Home prices are rising more slowly in regions with minimal rural land-use regulation.
Prices are also rising in regions with minimal land-use regulation, but the increases are nowhere near as fast as in areas with stricter regulation. Most of the increases in these areas are due to increases in incomes; value-to-income ratios still remain below 3.
Housing Preferences
In short, it doesn’t appear that the pandemic has so far significantly changed home price trends that existed before 2020. Those trends resulted from the fact that 80 percent of Americans aspired to live in single-family homes while only about 65 percent actually did so. Contrary to popular belief, there is little evidence that the aspirations of generations X, Y, and Z are any different; it’s just that they have been slightly less able to fulfill those aspirations.
One reason why less than 80 percent live in single-family homes is that so many states and urban areas have made housing expansive by limiting the land available for single-family home construction. People bidding up the artificially limited supply of single-family homes in regulated areas have made housing unaffordable in those areas while housing remains affordable in relatively unregulated areas.
For example, according to the 2019 American Community Survey, more than 70 percent of households in Idaho, Indiana, Iowa, Kansas, Maine, Michigan, Missouri, Nebraska, Oklahoma, and West Virginia live in single-family detached homes. All of these states have minimal rural land-use regulation. But only 57 percent of households in California live in single-family detached homes. California is a gigantic state, but thanks to strict rural land-use regulation, 95 percent of its residents were confined to 5 percent of the land area of the state as of the 2010 census.
I haven’t seen any surveys of housing preferences since the pandemic began, but it is safe to say that people who previously preferred or aspired to live in single-family homes weren’t persuaded by the pandemic that it would be better to live in multifamily complexes with shared front doors, hallways, elevators, and stairwells. Despite this, in the midst of the pandemic, density advocates are still demanding that Americans give up their “love affair with the single-family home.”
Why should Americans do so? It’s not like the nation is running out of land. In 2018, Bloomberg presented an in-depth analysis of land uses in the contiguous 48 states that was unfortunately marred by some deceptive graphics and a few misleading statements. The graphics showed that urbanized lands in the United States were extensive enough to completely cover eight states in the Northeast plus parts of two more.
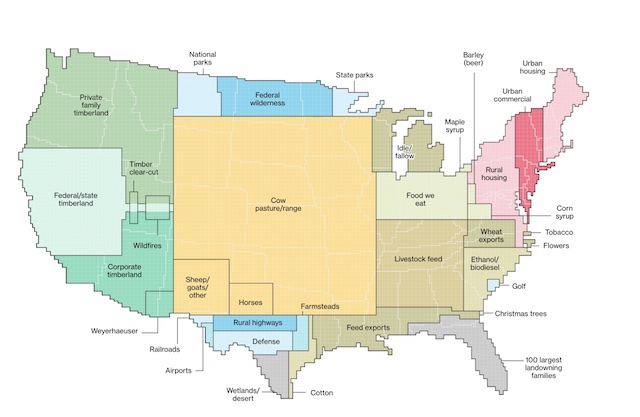
This map from a 2018 Bloomberg article, based on USDA data, makes it appear that urban areas occupy a significant portion of the country.
The map exaggerated the size of these states by making it appear that the northern tip of Maine is north of the U.S.-Canadian border in the West when in fact it is well over 100 miles south of that border. I call the other seven states “county states” because they are each smaller than Harney County, Oregon as well as other counties in Arizona, California, Nevada, and Wyoming.
A more accurate depiction of land uses in the 48 states reveals that only 3.7 percent of the United States has been urbanized. Although the Bloomberg story says that urbanization is growing at the rate of a million acres a year, that’s true only if you do an extreme rounding up: between 1990 (see table 27) and 2010, according to the Census Bureau, urbanization grew at 561,000 acres a year. Even if it were growing at a million acres a year, and continued to grow at that rate for 1,000 years, there would still be plenty of forests and agricultural lands in the United States. Such growth is unlikely, however, due to the tapering off of population growth.
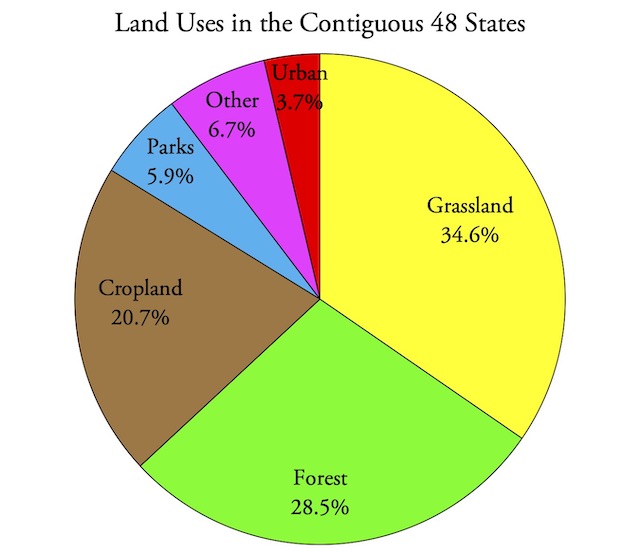
In reality, urban areas occupy less than 3.7 percent of the contiguous 48 states, and they aren’t growing as fast as the Bloomberg article indicates. “Parks” includes national and state parks, wilderness areas, and golf courses. “Other” includes military bases, rural roads, railroads, and airports, deserts, wetlands, and swamps.
(As an aside, another misleading statement in the Bloomberg article is the claim that the “single, major occupant” of 654 million acres of grasslands is cows. In fact, there is on average fewer than one cow—or bull or steer—for every 500 acres of that land. The real principal occupants are wildlife.)
Not Another Bubble
In areas with strict rural land-use regulation, housing prices have continued to climb and housing affordability has continued to decline during the pandemic. This unaffordability isn’t a true bubble, and it won’t lead to another financial crisis as it did in 2008. But neither will it be fixed by movements resulting from the pandemic. In fact, the pandemic is likely to worsen it as it will increase the number of people bidding on an artificially limited supply of single-family homes.


“Like many American cities with sky-high housing prices, Auckland has an urban-growth boundary,”
– I was under the impression that all US Urban Growth Boundaries in where there are high housing prices were in Counties or metro areas. Could the author provide examples of urban growth boundaries that only encompass high housing price cities?
Part of the reluctance to increase these urban limit lines may be due to the perception of lack of open space. Here in the San Francisco bay area only about 17% of the land is actually developed. However, talking with residents their perception is that over 70% is developed. This seems to be because most people only travel within their urban area along roads and freeways, and these are generally built up along each side. Leaving some open space between cities but allowing expansion away from freeways might leave the correct impression that the US is not heavily built up.
The AP continues to beat the dead UGB horse while ignoring that housing prices have risen significantly in places without UGBs. He also ignores massive inflation created by low interest, monetary policy, and unprecedented money printing. He ignores the bubbles the Fed has created in student loans/education, health care, Bitcoin, stocks, and of course housing. He should read Mises and Rothbard and learn about the Austrian business cycle theory and malinvestment before repeating the specious claim that UGBs are to blame for the housing bubble.
”
– I was under the impression that all US Urban Growth Boundaries in where there are high housing prices were in Counties or metro areas. Could the author provide examples of urban growth boundaries that only encompass high housing price cities?
” ~Sketter
Not sure what you’re looking for. It looks like you’re failing to pick up on that we use the term city interchangeably w/ the greater city + the city limits proper. IN this case, it’s the greater city.
What’s interesting about Aukland is that they’ve banned non-residents from buying properties. That is, they’re reduced and removed some things that would strain the supply.
And the prices just keep going up.
It shouldn’t be a problem. There’s about 1/15th the number of people in NZ as the UK. And yet they’re the same size. Plenty of space for sheep and people.
It’s pretty sexy in certain circles to yammer on and on about the missing middle. I don’t think it’s a solution for Aukland but it would help.
@Not sure what you’re looking for. It looks like you’re failing to pick up on that we use the term city interchangeably w/ the greater city + the city limits proper. IN this case, it’s the greater city.
-If that was the case then why do you blame City leaders and planners for an urban growth boundary that they have NO jurisdiction over?
Sketter,
The statement that high-priced cities have urban-growth boundaries doesn’t specifically blame city leaders. But those city leaders and planners strongly support the growth boundaries because they expect that some of the growth that might have taken place outside the boundaries will take place in the cities instead.
@AP
Sounds like Scapegoating to me.
Wouldn’t it make sense to blame the actually people who are in power and who have jurisdiction over UGBs? I’m not sure what criticizing someone who has no authority or jurisdiction over UGB does when you can criticize MPOs and Counties who do. That’s like blaming the planners in San Francisco for land use decisions that are 30+ miles away in the East Bay.
Help us out, Skeeter. When was the last time San Francisco’s mayor spoke out against Urban Growth Boundaries? Did the SF city council recently pass a resolution opposing them?
@Ted, I”m glad that you’ve found a magic bullet, just one thing that’s causing all the world’s problems.
For those of us who don’t believe in magic, UGB look to be a major contributor to housing prices.
@prk166, the guy with the most posts on this thread:
Thank you for engaging in an appeal to ridicule instead of providing a logical reply. I’ll know to ignore your future comments due to their extremely low quality.
@prk116, What you are doing is the textbook definition of scapegoating.
“Practice of singling out a person or group for unmerited blame and consequent negative treatment.”
@skeeter, note that those groups have not come out against it, they’re for it. Note that this is the last year this SF city council passed resolutions critizing and opposing domestic matters in countries half way around the world. If they can do that, they’d take issue with the urban growth boundary too. They’re part of the problem.
@ted, coming in swinging around a big ol’ magical silver bullet is quite low quality.
For example, if the problem is The Fed, what’s causing the housing prices at the rear end of the earth, New Zealand, to go up. They don’t have The Fed. That’s a US institution.
But here’s the core issue, the entire first world had a baby boomer generation. The biggest generation every. In every single country. And we are all more rich than we’ve ever been.
They’re all starting to retire. Markets are overflowing with boomer money DESPERATELY searching out investments, anything possible, out there.
Econ 101 —> Guess what happens to prices, in this case the price of money, when you have an abundant oversupply?
They go down.
How do we square @ted’s claim that it’s the Fed that’s driving low interest rates – low rates that lead to an increase in capital intensive enterprises like housing and mining – with half a million boomers trying to save up that last cent?
Could it be that it’s not just the Fed? Maybe?
@prk166 “note that those groups have not come out against it, they’re for it.”
-That is the classic Fallacy False Dilemma. That’s like when George Bush said that “Either you are with us, or you are with the terrorists.”
@prk: Please stop with the “silver bullet” straw man. I’ve not claimed that monetary policy is the only factor affecting housing prices. Of course demand and regulations are part of the equation.
Speaking of New Zealand, it’s not like they have a central bank and ultra low interest rates.
Oh, wait.
Could you post a reply without being a snarky bitch? Maybe?
Boulder