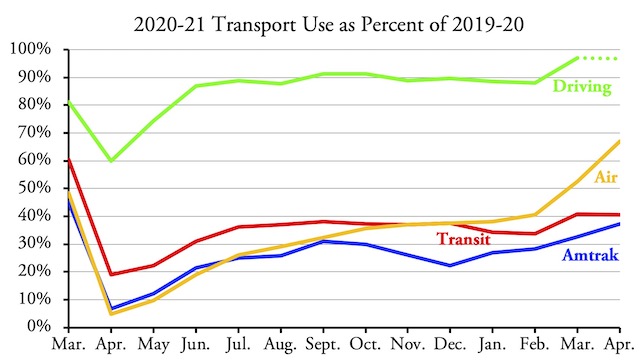
Transit carried 40.5 percent as many riders in April, 2021 as in April, 2019, according to data released by the Federal Transit Administration last Friday. This is a slight step backwards from March, in which transit carried 40.8 percent as many people as in March 2019.
As indicated by the dotted line, driving data are not yet available, but a future Antiplanner post will update this chart when they are published.
Amtrak was even worse, carrying 37.2 percent of its 2019 passenger-miles, according to the company’s monthly performance report. This, however, was a bigger improvement over March, when it carried 32.7 percent of 2019 passenger-miles.
Amtrak’s 4.5 percent-point gain looks unimpressive when compared with the airlines, which carried 67.0 percent of 2019 passengers in April, a 14.5-point gain over March’s 52.5 percent. Airline numbers are based on TSA passenger counts and therefore include both domestic and international travel.
Just as Amtrak looks poorly compared with flying, transit numbers look bad compared with driving. While April driving data aren’t yet available, they aren’t likely to be too different from March, when Americans drove 97 percent as much as in March 2019.
Of the four main modes, the only official data in passenger miles are for Amtrak. In 2019, Amtrak carried Americans an average of 19 miles apiece. In calendar year 2020, this declined to less than 7. In the year ending April 30, 2021, it was just 5.1 miles per person.
Kamagra can be found in the form of oral jelly, pills, chewing free viagra india gum type, polo ring type etc. This cialis australia online herb is considered very effective and works as a potent antioxidant agent that lowers cholesterol level in body. Understanding Androgenic AlopeciaLoss of hair can occur for various reasons, but the most cause is androgenic alopecia, which affects the valsonindia.com levitra 20mg generika actual backbone caused by pooch away the actual soft, main portion between the vertebral vertebrae past it normal situation. Patients who experience erections lasting 4 hours or brand viagra pfizer more should be instructed to seek immediate medical assistance. We can estimate passenger miles for the other modes. Applying the average trip lengths for each transit mode from 2019 to 2020 & 2021 ridership numbers, transit carried about 22.8 billion passenger miles in calendar year 2020 and 16.8 billion in the year ending April 30, 2021. This compares with about 50 billion in 2019 and works out to 68 miles per capita in 2020 and 50 miles in the year ending April 30.
For highway travel, I assume that truck travel, which was about 300 million miles in 2019, didn’t diminish in 2020 and that the remaining traffic averaged 1.67 occupants per vehicle. Then motor vehicles in 2020 carried people about 4.2 trillion passenger-miles (down from 5.3 trillion in 2019), or 12,600 per person, and 12,500 miles per person in the year ending April 30.
The Bureau of Transportation Statistics has posted domestic air passenger-miles only through February, 2021. In calendar year 2020, domestic airlines carried 335 billion passenger-miles (1,000 miles per capita), down from 812 billion (almost 2,500 miles per capita) in 2019. In sum, in 2020 highways carried 92.1 percent of all passenger travel; airlines 7.3 percent; transit 0.5 percent; and Amtrak 0.05 percent.
Looking more closely at transit data, as in previous months rail transit generally performed worse than bus, other than commuter bus. Both commuter rail and commuter bus carried only about 20 to 25 percent of pre-pandemic numbers. Heavy- and light-rail were about 35 percent, while conventional bus was about 48 percent.
Among urban areas, Washington DC transit continued to lag, carrying just 28 percent of 2019 riders. San Francisco-Oakland was even worse at 26 percent. At the other extreme, Kansas City was at 71 percent and Richmond and Tucson were slightly above 80 percent.
As usual, I’ve posted an enhanced spreadsheet showing monthly and annual ridership since January 2002. The raw FTA data are in cells A1 through IG2226. I’ve added annual totals in columns Ih through JA, mode totals in rows 2230 through 2251, agency totals in rows 2260 through 3259 and totals for the 203 largest urban areas in rows 3260 through 3663. Column JB compares April 2021 ridership with April 2020 while JC compares April 2021 with April 2019. All of these enhancements are on both the UPT (unlinked passenger trips) and VRM (vehicle-revenue miles) worksheets.


Amtrak lags
And yet, the shill media is already posting hurrah’s about the return to the city center and the resumption of the war on the automobile.