
Airlines carried Americans 77 percent as many miles of domestic travel in 2021 as they did in 2019, according to data recently released by the Bureau of Transportation Statistics. International air travel was still far short of pre-pandemic levels, being just 29 percent of 2019 numbers. The 578 billion miles of domestic air travel was about the same as in 2013, while the 1,743 miles per capita was slightly more than in 2003.
 Click image to download a four-page PDF of this policy brief.
U.S. airlines are, or should be, the envy of the world. They carry Americans far more miles per capita than airlines (or, for that matter, railroads) of almost any other country. Airport infrastructure is in excellent condition: as of 2020, 85 percent of commercial airport runways were in good condition, 13 percent in fair condition, and only 1 percent in poor condition. U.S. airlines’ safety record is second to none, experiencing just 14 fatalities while carrying more than 7 trillion passenger-miles since 2010. And airlines do all this at a profit: while some companies have lost money in some years, the domestic airline industry as a whole earned a profit in every year since 2010.
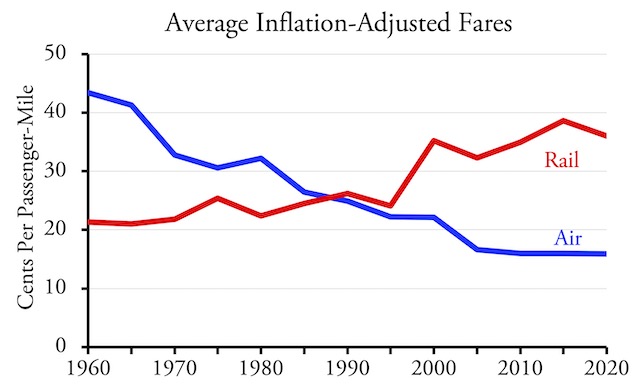
Thanks to airline deregulation and competition, inflation-adjusted airfares have dropped 63 percent since 1960. Thanks partly to government monopoly, rail fares have increased 68 percent since 1960.
Consumers have benefitted enormously from the growth of air travel. In 1960, airfares per passenger-mile were more than twicerail fares and the average American flew fewer than 180 miles a year (which was still more than the 100 miles a year they rode intercity passenger trains). In 1970, air fares were 50 percent more per passenger mile than rail fares, and per capita air travel exceeded 500 miles while per capita rail travel had fallen to just 30 miles.
By 1990, air and rail fares were about equal, but air travel was more than 1,350 miles per capita while rail travel was down to 24. Since 2016, air fares have been only about half of Amtrak fares, and the average American has flown domestically more than 2,200 miles a year, well over a 100 times as many miles as they have taken Amtrak. As an airline ad once said, Americans were “now free to move about the country.” By comparison, at their peak during World War II, railroads carried Americans fewer than 700 miles per capita in 1944 and outside of wartime they never carried more than 450 miles per capita per year.
Affordable air travel is mostly possible because the U.S. airline industry is lightly regulated and highly competitive. While there have been a lot of mergers and those mergers are often accompanied by speculation that oligopolies would lead to rising fares, this hasn’t happened, partly because new airlines have been created to fill in the gaps.
In 1970, the United States had fewer than 40 U.S. airlines. In just seven years after airline deregulation in 1978, entrepreneurs started more than 60 new airlines. Some went out of business, some were taken over by existing airlines, while entrepreneurs continued to open several new airlines each decade. As of 2020, there were still about 60 airlines in the U.S., 50 percent more than in 1970.
Five Business Models
Airlines compete using several different business models. First, three of the nation’s largest, American, Delta, and United, serve almost every part of the country using spokes radiating from multiple hubs. People can go from just about any major urban area to just about any other major urban area on any of these airlines with no more than one change of planes, and chances are at least one of the airlines will offer non-stop flights. People going between a smaller urban area and a major one might need two changes of planes, and trips between two small urban areas located across the country from one another might need three changes.
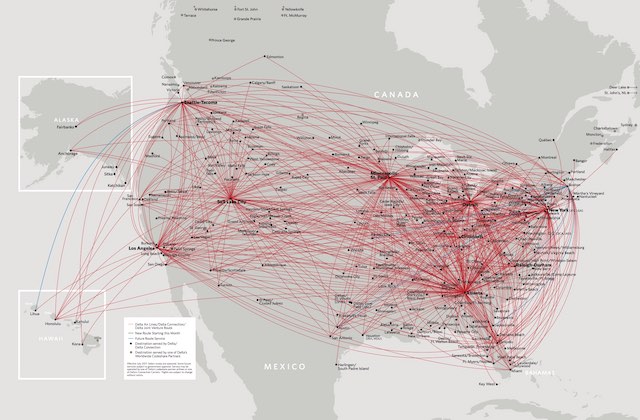
Delta Airlines, whose route map is shown here, has nine hubs in the U.S. (Two of them, JFK and LaGuardia, appear to be only one on this map.) American has ten hubs; United has eight. Alaska has only five and all are on the West Coast.
The Big Three airlines all trace their roots back to the 1920s. They each typically carry more than 100 billion passenger-miles per year in domestic flights and another 80 billion or more in international flights.
Alaska Airlines, which dates to 1932, was a regional airline in the 1990s that has grown to become a national airline by replicating the hub-and-spoke model. So far, however, all of its hubs are on the West Coast. That makes it a powerful competitor with the Big Three for traffic to and from the West Coast, but it lacks eastern and midwestern hubs that would allow it to compete in the rest of the country. Between 2002 and 2019, it quadrupled the number of passenger-miles that it carried, compared with around 70 percent growth for the Big Three, but still carried only about 50 billion in 2019.
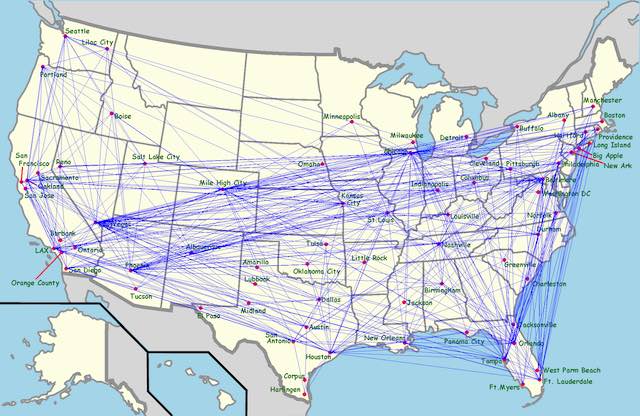
Southwest Airlines route map may appear to have hubs, but it doesn’t try to serve smaller urban areas with spokes from those hubs.
The major competitor to the hub-and-spoke model was pioneered by Southwest Airlines, which began operating in 1967. Instead of hubs and spokes, it mainly serves the nation’s largest urban areas with direct flights to other major urban areas. Southwest serves about 100 airports, less than half the number served by each of the Big Three, but since 2000 it has been the nation most profitable airline because it focused on the most popular routes. As of 2019, it carried almost as many domestic passenger-miles as each of the Big Three but did not have a significant international component.
Southwest is sometimes called a low-cost airline because it skips some amenities such as business or first-class service, free in-flight meals, and—initially, at least—in-flight entertainment. In fact, it should be called the high-revenue model because it focused on the most lucrative routes. JetBlue followed the high-revenue, non-hub-and-spoke model when it began operating in 1998 but offered extra amenities such as television and other in-flight entertainment at every seat. Since 2002, when it was just starting out, it is the only airline that has grown faster than Alaska, but as of 2019 it hadn’t yet reached Alaska’s size, carrying about 40 billion passenger-miles.
Going in the opposite direction from JetBlue are the ultra-low-cost airlines, a model pioneered by Spirit and Allegient, with Frontier and Sun Country adopting the model as well. These airlines offer very low airfares but charge extra for things that other airlines normally offer for free such as checked or carry-on luggage, in-flight beverages, and advance seat selection. Spirit actually earns 40 percent or more of its revenue from such additional charges. These airlines are all smaller than JetBlue, although Spirit was getting close before the pandemic and actually carried more passenger-miles than JetBlue in 2020.
Another category of airlines would be regional carriers, but most of these have been gobbled up in acquisitions by the Big Three or, in Alaska’s case, grown to be a national airline. One airline that might be called a regional is Hawaiian. It offers flights between Hawaii and many mainland cities, but no flights between mainland cities. A better example of a regional airline is Silver Airways, which offers flights between Florida and other parts of the South and the Caribbean.
This plane is in American Airlines livery but is actually owned and operated by SkyWest, which also operates feeder planes for Alaska, Delta, and United. Photo by Eric Salard.
Much more important than the regional airlines are feeder airlines, which provide many of the spokes to small towns from Big Three and Alaska hubs. One regional, Horizon, is wholly owned by the Alaska Air Group and two others, Envoy and PSA, are wholly owned by the American Airlines Group.
Most feeders, including Mesa, Republic, and SkyWest, are independent companies that serve multiple national airlines with planes painted in the other airline liveries. A few smaller feeders, including Air Wisconsin, CommutAir, and Endeavor, are contracted to serve just one of the major airlines. Most of these companies remain independent because union rules make acquisition of the feeders costly for the hub-and-spoke airlines.
As of 2019, all these models–national hub-and-spoke systems, high-revenue systems, ultra-low-cost systems, regionals, and feeder systems–were making money and most were able to fill at least 80 percent of seats. There is no reason to think that one model is intrinsically better than one another; instead, they all seem to fill complementary needs. This kind of diversity is a natural result of a fairly free market system with a minimum of government control.
How to Start an Airline
Despite mergers, the airline industry has remained dynamic because of the low costs of entry. Building a new railroad is really expensive while starting a bus company is cheap: just buy a couple of buses and find somewhere to store and maintain them when not in use. Starting an airline is almost as easy as starting a bus company.
The first step is to find an airport that has enough excess capacity to provide gates and landing slots for the planes. It is helpful, though not absolutely necessary, if the airport serves a major urban area. Second, lease some planes. Planes are too expensive for a start-up to buy but are readily available for lease.
The hard part is to design flight schedules and fares that make maximum use of planes. Back in the early 2000s, U.S. airlines filled only two-thirds of their seats and most lost money. By 2019, airlines were filling more than five out of six seats and earning a profit. It also helps to keep planes in the air as much as possible, as planes on the ground aren’t earning any money. In 1960, the average commercial airliner flew 1,300 miles a day; by 2019, it was more than 3,200.
Finally, the biggest and most variable airline cost is fuel. The best way to handle that is to get long-term contracts for fuel when prices are low. If prices go up, the airline is doing well; if prices go down, it is stuck with the long-term price. To deal with that, airlines have developed various ways of hedging fuel prices.
Saving Energy
In 1970, airlines used 10,382 British thermal units (BTUs) per passenger-mile. By 2019, this had fallen to 2,219. They achieved this dramatic reduction in two ways.
First, they filled more seats. In 1970, more than half the seats on the average domestic flight were empty. By 2019, as noted above, five out of six were full. They also increased the number of seats per plane by about 28 percent, whether by moving seats closer together or buying bigger planes.
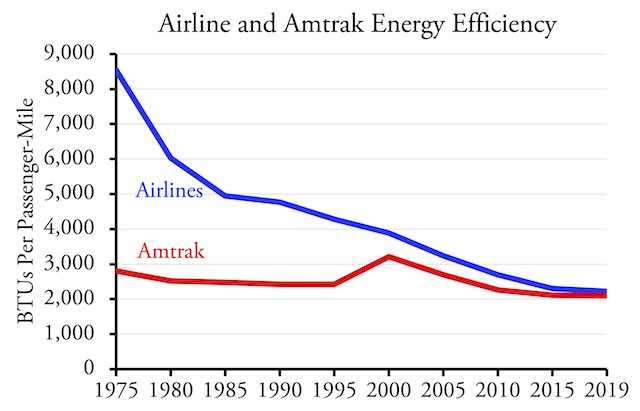
Thanks to increased passenger loadings and improved aircraft and engines, the energy efficiency of air travel was nearly tied with Amtrak travel in 2019.
Second, aircraft and engine manufacturers built planes that were more energy efficient. In 1970, the average commercial airliners drank 3.8 gallons of fuel per mile. By 2019, this had dropped to 1.8, better than a 50 percent improvement. Thus, roughly half the improvement since 1970 came from more fuel-efficient planes while the rest came from increased numbers of passengers per plane.
The 2,200 BTUs per passenger mile used by planes in the late 2010s are not much more than used by Amtrak. One problem with Amtrak numbers is how the BTUs for electric-powered vehicles should be calculated. Heat losses cost combustion engines close to two-thirds of their power, while electric motors don’t lose that. However, generating and transmitting the electricity loses about two-thirds of the power before it is delivered to end-users.
In 2016 and before, the Department of Energy included this power loss in its calculations of energy consumption by Amtrak and other electrically powered transportation. Starting in 2017, it did not, which suddenly made Amtrak appear a lot more energy efficient. This wasn’t the only data trick played during the Obama administration, and I suspect changes like this were made to politically promote some kinds of transportation over others.
Apparently, not everyone in the Bureau of Transportation Statistics agrees with this trick, as it currently publishes tables showing Amtrak energy efficiencies both with and without the losses from generation and transmission. Accounting for the losses, Amtrak used 2,100 BTUs per passenger-mile in 2019, only 5 percent less than air.
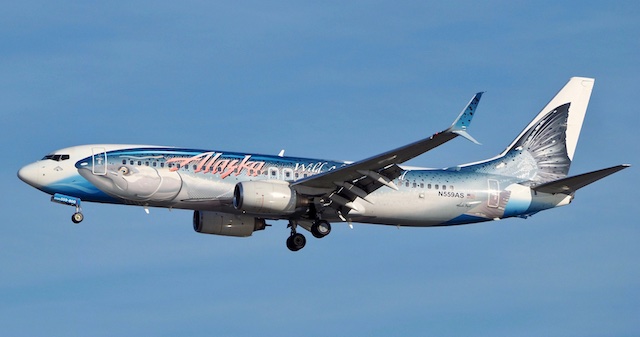
Adding winglets to the ends of wings reduces energy consumption by about 5 percent. The salmon painting, however, did not save energy. Photo by Ganesh Paneer.
When it comes to greenhouse gases, if electricity is generated from non-fossil-fuel sources, then Amtrak’s energy efficiency is more meaningful. But most electricity in this country comes from coal, gas, or other fossil fuels, and totally eliminating fossil-fuel power plants will be difficult enough without adding the burden of transportation (which uses far more energy than is currently generated by the nation’s electrical power plants) to the mix.
In the long run, airlines can become completely green by relying on biofuels instead of petroleum fuels. One study found that biofuels made by buying forest and farm waste could meet at least two-thirds of airline energy needs at not much more than the cost of petroleum fuels. On a large scale, costs could be reduced to make that all of airline needs.
Transportation Subsidies
In 2019, federal, state, and local governments collected $41.8 billion from airlines, mostly in the form of ticket taxes and fees. They spent $50.3 billion supporting airlines, mostly for airport improvements. That’s a net subsidy of $8.5 billion, $5.5 billion of which was at the state and local level and $3.0 billion at the federal level. Since U.S. airports served more than 1.5 trillion passenger-miles of domestic and international travel, this represents subsidies of well under a penny per passenger-mile.
Early in the history of air travel, the federal government offered financial assistance to airport construction. That ended in 1970; instead, the government adopted a number of ticket taxes and fees to support airports. There are several different taxes and feesassociated with air travel, but in total a typical ticket of $400 includes about $60 in fees, plus the airlines themselves pay fuel taxes.
The main problem with this is the cross-subsidies involved in the distribution of airline ticket fees. Most of these fees are supposed to go to airport improvements, but they don’t necessarily go to the airports being used by the passengers paying the fees. The largest airports that serve almost three out of four air travelers only get 17 percent of the fees. The smallest airports that serve only 12 percent of travelers get 73 percent of the fees. This might be why heavily used airports like LaGuardia or Newark seem old and dirty while smaller airports like Bozeman or Bend seem young and fresh.
Aside from airport improvements, one subsidy that emerged from deregulation was for what is called essential air service. At the time of deregulation, Congress feared that airlines would abandon service to smaller communities, and so provided subsidies to air service in those communities. As of 2019, essential air service subsidies went to airlines serving about 160 communities and totaled about $320 million, or about 4 percent of the total subsidies. While this is questionable, it is probably less important than the cross-subsidies associated with the distribution of ticket fees.
Airlines and the Pandemic
Airlines are sensitive to economic changes. The 9/11 terrorist attack, the 2008 financial crisis, and the pandemic each put most airlines well into the red. Congress responded to 9/11 by giving the airlines as much as $10 billion in federally guaranteed loans, which were all eventually paid back.
Like all forms of transportation, air travel declined dramatically at the beginning of the pandemic, with April 2020 passenger-miles falling to 10 percent of April 2019. Air travel was quicker to recover than Amtrak, however, reaching 90 percent of pre-pandemic numbers in June 2021 and 94 percent in October. Since then, it has declined, but so has Amtrak.
Congress responded to the pandemic by giving airports $20 billion ($10 billion in the CARES Act, $2 billion in the CRRSAA, and $8 billion in the American Rescue Plan). Congress also offered $40 billion to the passenger airlines for “payroll protection.” In exchange, the airlines had to keep operating 80 percent of their pre-pandemic flights. Only about $30 billion of this was accepted by the airlines.
These grants were welcomed by airline workers but were probably unnecessary from the airline point of view. The airline industry has shown its resilience in the face of losses that it eventually makes up for in more profitable years. For example, between 9/11 and the financial crisis the domestic airlines lost $56 billion in the 2000s, but they made $105 billion in the 2010s. The airlines lost $24 million in 2020 but started earning profits again in 2021.
Flying into the Future
Americans are the most mobile people on earth and airliners will continue to be the second-most important source of that mobility. Domestic air travel has recovered from the pandemic faster than any form of travel except driving, with passenger-miles in November 2021 exceeding 94 percent of November 2019. Air’s high speeds, low costs, and safety record are enough to overcome the fears of crime and infectious disease that are keeping many people away from transit. Especially if a reliable source of biofuels can be developed, the future of U.S. airlines is bright.


.jpg)
Talk of biofuels makes it urgent that we realize that there is NO CLIMATE CRISIS!
THE CLIMATE HAS ALWAYS CHANGED!
5000 years ago, there was the Egyptian 1st Unified Kingdom warn period
4400 years ago, there was the Egyptian old kingdom warm period.
3000 years ago, there was the Minoan Warm period. It was warmer than now WITHOUT fossil fuels.
Then 1000 years later, there was the Roman warm period. It was warmer than now WITHOUT fossil fuels.
Then 1000 years later, there was the Medieval warm period. It was warmer than now WITHOUT fossil fuels.
Then 1000 years later, came our current warm period. You are claiming that whatever caused those earlier warm periods suddenly quit causing warm periods, only to be replaced by man’s CO2 emission, perfectly in time for the cycle of warmth every 1000 years stay on schedule. Not very believable.
The entire climate scam crumbles on this one observation because it shows that there is nothing unusual about today’s temperature and ALL claims of unusual climate are based on claims of excess warmth caused by man’s CO2.
http://www.debunkingclimate.com/warm_periods.html
http://www.debunkingclimate.com/climatehistory.html
http://www.debunkingclimate.com/warm_periods.html
http://www.debunkingclimate.com
Feel free to disagree by showing actual evidence that man’s CO2 is causing serious global warming.
Safety record…when a bus stops working you can potentially get out of it, and doesn’t fall out of the sky.
How much did we pour in subsidies to airports and airline bailouts and airline companies tax credits.
but usually public transport is subsidised. So if airplane travel is subsidisied (which is the case in some remote areas to promote accessability), it can be considered public transport. Fully commercially viable long-distance train services on the other hand are not considered public transport in this definition. You could argue, that public transport is everything that is publicly and universally accessible, which of course would include trains and planes as well. The form of organisation (state-owned or private) of the transit company however, is irrelevant to this question.