
Americans are leaving the cities. Between July 1, 2020 and July 1, 2021, New York City lost 305,000 residents. Los Angeles County lost nearly 160,000. Cook County, home of Chicago, lost nearly 90,000. San Francisco lost nearly 55,000. The counties in which Boston, Dallas, Miami, Philadelphia, San Jose, Seattle, and Washington are located each lost well over 20,000. Collectively, the counties containing 26 of the nation’s 33 largest cities lost nearly 900,000 residents.
 Click image to download a five-page PDF of this policy brief.
Changes in population in 2021 are particularly revealing because the nation’s overall population hardly grew that year. The Census Bureau estimates that 2021 numbers were only 0.1 percent greater than in 2020, the slowest growth rate since the nation began. Thus, local population changes mainly reflect people’s preferences about where they want to live, not birth rates or foreign immigration.
The Census Bureau recently published 2021 population estimates for every county in the nation. So far, it hasn’t published estimates for the cities themselves. However, in some cases, including Denver, New York, and San Francisco, the cities and counties are the same while in many other cases, such as Chicago, Dallas, and Portland, the central cities are mostly in one county and the suburbs are mostly in other counties.
The Census Bureau has also published data for metropolitan statistical areas (MSAs), which consist of all the land in the counties in which some part of a central city or its suburbs are located. MSAs are a popular way of comparing urban areas because they are so easy to use: simply add up the data in each MSA’s counties. They are inappropriate for many uses: for example, densities make no sense for MSAs that may include a lot of rural land. The Riverside-San Bernardino MSA has more than 4.6 million people, but more than 90 percent of it is rural, mostly the nearly uninhabitable Mohave Desert.
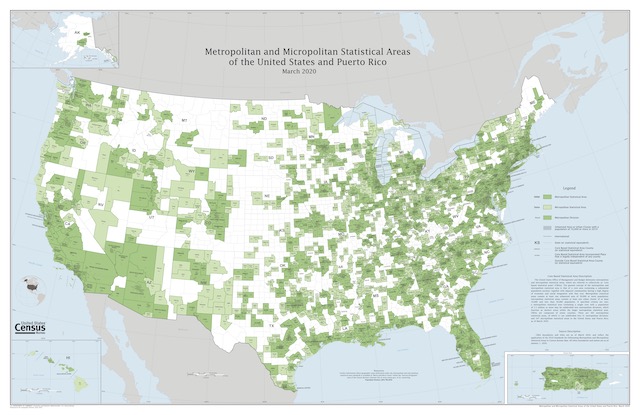
Metropolitan statistical areas of more than 50,000 people are in dark green and micropolitan statistical areas of 2,500 to 50,000 people are in light green. The green areas cover more than half the country, but urban areas of more than 2,500 people cover just 3 percent of the nation’s land. Thus, most of the areas in green are actually rural. Click image to download a 7.4-MB PDF of this map.
Until the Census Bureau publishes population data for individual cities, MSAs can serve as a proxy for population changes in cities and their suburbs. While two of the nation’s largest MSAs, San Diego and Las Vegas, as well as many smaller MSAs, consist of just one county, most of the larger ones and many smaller ones include more than one county. Population changes for the county in which the biggest city in a region is located can serve as a proxy for population changes in that city itself. For example, Chicago makes up the bulk of Cook County, San Antonio of Bexar County, and Portland of Multnomah County, all of which are surrounded by other counties.
To make this comparison, I used census records for the 2020-2021 population change for multi-county MSAs and the county in each MSA in which the central city is located. In doing so, I discovered that the Census Bureau’s 2021 MSA file is missing a lot of MSAs, including Austin, Tampa-St. Petersburg, Richmond, and many smaller ones. Since the Census Bureau’s county file includes all counties, I was able to add about 20 MSAs to the list, but I didn’t try adding all of the ones smaller than 500,000 residents as most consist of only one or two counties. That left me with data for 170 MSAs.
| MSA | 2021 Population | Central County Growth | Suburban Counties Growth |
|---|---|---|---|
| New York, NY | 19,768,458 | -305,465 | -22,490 |
| Los Angeles, CA | 12,997,353 | -159,621 | -16,292 |
| Chicago, IL | 9,509,934 | -89,595 | -2,076 |
| Dallas, TX | 7,759,615 | -24,907 | 93,702 |
| Houston,TX | 7,398,774 | -4,461 | 73,555 |
| Washington, DC | 6,356,434 | -29,962 | 682 |
| Atlanta, GA | 6,144,050 | -3,689 | 46,593 |
| Miami, FL | 6,091,747 | -29,682 | -5,012 |
| Phoenix, AZ | 4,946,145 | 58,246 | 20,257 |
| Boston, MA | 4,899,932 | -23,682 | -12,897 |
| Riverside, CA | 4,653,105 | 35,631 | 11,970 |
| San Francisco, CA | 4,623,264 | -54,813 | -61,572 |
| Detroit, MI | 4,365,205 | -15,409 | -5,134 |
| Philadelphia, PA | 4,228,601 | -27,293 | 13,911 |
| Seattle, WA | 4,011,553 | -20,266 | 7,089 |
| Minneapolis, MN | 3,690,512 | -13,851 | 11,942 |
| Tampa, FL | 3,219,514 | 14,814 | 21,315 |
| Denver, CO | 2,972,566 | -6,167 | 9,444 |
| Baltimore, MD | 2,838,327 | -6,634 | 3,270 |
| St. Louis, MO | 2,809,299 | -5,651 | -3,317 |
| Charlotte, NC | 2,701,046 | 3,936 | 27,445 |
| Orlando, FL | 2,691,925 | -7,153 | 23,391 |
| San Antonio, TX | 2,601,788 | 14,184 | 20,921 |
| Portland, OR | 2,511,612 | -12,494 | 7,876 |
| Sacramento, CA | 2,411,428 | 2,680 | 9,397 |
| Pittsburgh, PA | 2,353,538 | -10,627 | -3,128 |
| Austin, TX | 2,322,666 | 9,054 | 44,247 |
| Cincinnati, OH | 2,259,935 | -3,770 | 6,038 |
| Kansas City, MO | 2,199,490 | -1,827 | 7,739 |
| Columbus, OH | 2,151,017 | -2,599 | 12,574 |
| Nashville, TN | 2,143,407 | -11,533 | 28,666 |
| Indianapolis, IN | 2,126,804 | -5,668 | 18,772 |
| Cleveland, OH | 2,075,662 | -12,309 | 2,614 |
| San Jose, CA | 1,952,185 | -45,090 | 2,170 |
| Virginia Beach, VA | 1,895,105 | -1,701 | 4,948 |
| Providence, RI | 1,675,774 | -1,794 | 2,167 |
| Jacksonville, FL | 1,637,666 | 3,962 | 22,316 |
| Milwaukee, WI | 1,566,487 | -10,090 | 2,979 |
| Raleigh, NC | 1,448,411 | 16,651 | 11,535 |
| Oklahoma City, OK | 1,441,647 | 1,279 | 11,659 |
| Richmond, VA | 1,348,732 | -66 | 8,749 |
| Memphis, TN | 1,336,103 | -4,190 | 2,982 |
| Louisville, KY | 1,284,566 | -4,249 | 3,757 |
| Salt Lake City, UT | 1,263,061 | 185 | 3,359 |
| New Orleans, LA | 1,261,726 | -6,311 | -2,329 |
| Hartford, CT | 1,211,906 | -1,078 | 1,479 |
| Buffalo, NY | 1,162,336 | -2,571 | -1,080 |
| Birmingham AL | 1,114,262 | -5,521 | 5,073 |
| Grand Rapids, MI | 1,091,620 | 6 | 3,411 |
| Rochester, NY | 1,084,973 | -3,394 | -409 |
| Tulsa, OK | 1,023,988 | 2,701 | 4,698 |
| Chattanooga, TN | 1,008,742 | 2,144 | 1,898 |
| Omaha, NE | 1,008,740 | -2 | 3,146 |
| Worcester, MA | 978,447 | 568 | 178 |
| Albuquerque, NM | 918,259 | -2,188 | 3,268 |
| Albany, NY | 899,286 | -625 | 1,350 |
| Knoxville, TN | 893,412 | 6,551 | 5,233 |
| El Paso, TX | 871,234 | 1,854 | 91 |
| Sarasota, FL | 859,760 | 11,393 | 11,260 |
| Baton Rouge, LA | 851,216 | -2,583 | 4,589 |
| Columbia, SC | 838,250 | 1,780 | 5,703 |
| Dayton,OH | 813,516 | -789 | 830 |
| Charleston, SC | 813,052 | 3,606 | 6,485 |
| Boise, ID | 795,268 | 13,947 | 11,740 |
| Greensboro, NC | 778,848 | 1,063 | 2,024 |
| Des Moines, IA | 719,146 | 4,075 | 4,228 |
| Ogden, UT | 706,696 | 3,793 | 6,283 |
| Poughkeepsie, NY | 701,637 | 3,203 | 1,370 |
| Akron, OH | 700,015 | -1,897 | 607 |
| Provo, UT | 687,141 | 21,843 | 331 |
| Daytona Beach, FL | 685,344 | 9,511 | 4,964 |
| Madison, WI | 683,183 | 1,645 | 54 |
| Winston-Salem | 681,438 | 3,790 | 1,279 |
| Syracuse, NY | 658,281 | -2,417 | -196 |
| Durham, NC | 654,012 | 524 | 2,296 |
| Wichita, KS | 647,919 | -418 | 416 |
| Toledo, OH | 644,217 | -1,537 | -65 |
| Springfield, MA | 624,290 | -2,190 | -492 |
| Augusta, GA | 615,933 | -655 | 4,868 |
| Harrisburg, PA | 596,305 | 856 | 3,088 |
| Spokane, WA | 593,466 | 5,340 | 860 |
| Jackson, MS | 587,202 | -3,957 | 533 |
| Scranton, PA | 567,750 | 996 | 180 |
| Portland, ME | 556,893 | 1,919 | 2,885 |
| Youngstown, OH | 538,069 | -1,186 | -431 |
| Fayetteville, NC | 524,588 | 1,138 | 3,096 |
| Lexington, KY | 517,846 | -610 | 1,428 |
| Pensacola, FL | 516,388 | -34 | 4,865 |
| Myrtle Beach, SC | 509,794 | 12,081 | 6,131 |
| Port St. Lucie, FL | 505,321 | 12,304 | 1,413 |
| Huntsville, AL | 502,728 | 5,515 | 3,195 |
| Reno, NV | 497,535 | 6,004 | 37 |
| Lafayette, LA | 479,212 | 2,201 | -1,066 |
| Lansing, MI | 472,404 | -486 | 136 |
| Asheville, NC | 472,341 | 1,913 | 974 |
| Salem, OR | 436,283 | 917 | 2,301 |
| Salisbury, MD | 429,233 | 8,615 | 1,211 |
| Mobile, AL | 428,220 | -1,177 | -149 |
| Fort Wayne, IN | 423,038 | 2,716 | 114 |
| Corpus Christi, TX | 422,778 | 927 | -11 |
| Savannah, GA | 410,008 | 1,425 | 3,530 |
| Shreveport, LA | 389,155 | -3,964 | 594 |
| Montgomery, AL | 385,798 | -1,014 | 1,074 |
| Davenport, IA | 381,568 | -318 | -1,640 |
| Huntington WV | 356,581 | -1,051 | -1,468 |
| Lincoln, NE | 342,117 | 1,604 | -2 |
| Gainesville, FL | 341,756 | 554 | 1,539 |
| Rockford, IL | 336,278 | -1,739 | -167 |
| Green Bay | 329,490 | 850 | 317 |
| Columbus, GA | 327,536 | -1,343 | -262 |
| Lubbock, TX | 325,245 | -219 | 3,251 |
| South Bend, IN | 323,695 | -337 | -80 |
| Wausau, WI | 310,727 | -306 | 167 |
| Kingsport, TN | 308,661 | 1,173 | 82 |
| Kennewick, WA | 308,293 | 2,795 | 1,192 |
| Cedar Rapids, IA | 275,435 | -1,324 | 313 |
| Amarillo, TX | 269,703 | -1,626 | 2,509 |
| Charleston WV | 255,020 | -2,096 | -724 |
| Fargo, ND | 252,136 | 1,694 | 223 |
| Binghampton, NY | 245,220 | -959 | -375 |
| Appleton, WI | 244,084 | 713 | 63 |
| Charlottesville, VA | 239,635 | -751 | 2,044 |
| Macon, GA | 233,883 | -342 | 633 |
| Topeka, KS | 232,670 | -344 | 267 |
| Rochester, MN | 227,151 | 445 | 191 |
| Burlington VT | 226,611 | 576 | 472 |
| Lafayette, IN | 224,709 | 829 | 201 |
| Athens, GA | 217,759 | 222 | 2,899 |
| Columbia, MO | 213,123 | 1,946 | 50 |
| Lake Charles, LA | 210,362 | -11,134 | -539 |
| Johnson City, TN | 208,068 | 1,156 | -350 |
| Springfield, IL | 206,898 | -1,278 | -101 |
| Houma, LA | 206,212 | -611 | 9 |
| Monroe, LA | 204,884 | -1,235 | -438 |
| St. Cloud, MN | 200,406 | 598 | 121 |
| Florence, SC | 199,259 | -301 | -78 |
| Warner Robins, GA | 192,246 | 2,587 | 382 |
| Joplin, MO | 182,541 | 389 | 773 |
| Yuba City, CA | 182,484 | -417 | 1,489 |
| Jonesboro, AR | 181,195 | 642 | -233 |
| Jackson, TN | 180,799 | -2 | 418 |
| Eau Claire, WI | 173,317 | 634 | 586 |
| Midland, TX | 173,180 | -2,252 | -39 |
| Hattiesburg, MS | 173,078 | 985 | -194 |
| Greenville, SC | 172,169 | 6,854 | 3,755 |
| Idaho Falls, ID | 162,786 | 3,304 | 1,224 |
| Elizabethtown, KY | 156,766 | 888 | 308 |
| Decatur, AL | 156,758 | 332 | 27 |
| Dothan, AL | 151,618 | 268 | 318 |
| Albany, GA | 150,592 | -522 | -147 |
| Winchester, VA | 145,155 | 128 | 2,186 |
| Morristown, TN | 143,855 | 33 | 992 |
| Rocky Mount, NC | 143,535 | 149 | -338 |
| Rapid City, SD | 141,979 | 2,331 | 320 |
| Morgantown, WV | 140,745 | 471 | 182 |
| Harrisonburg, VA | 135,824 | -245 | 636 |
| Cleveland, TN | 127,938 | 1,421 | 217 |
| Glens Falls, NY | 126,574 | -187 | -20 |
| Ames, IA | 126,195 | 857 | 32 |
| New Bern, NC | 122,273 | 122 | 163 |
| St. Joseph, MO | 120,424 | -762 | 5 |
| Victoria, TX | 117,854 | -272 | 158 |
| Weirton, WV | 115,585 | -318 | -692 |
| Mankato, MN | 103,612 | 107 | -158 |
| Lima, OH | 101,670 | -270 | -119 |
| Cape Girardeau, MO | 97,699 | 325 | -108 |
| Parkersburg, WV | 88,687 | -372 | -120 |
| Pine Bulff, AR | 86,412 | -950 | 128 |
| Bloomsburg PA | 82,959 | 205 | -28 |
| Hinesville, GA | 62,863 | 491 | 865 |
The Nation’s Densest Regions Are Shrinking
The county-by-county comparison revealed several patterns. First, populations of big, dense cities almost all declined. Out of 33 MSAs with more than 2 million people, populations declined in 26 central counties in in 2021. This includes nearly 80 percent of such metropolitan areas not counting San Diego (which almost certainly declined) and Las Vegas (which may not have declined). About two-thirds of the central counties in MSAs of 1 to 2 million people are also declining, including such MSAs as Birmingham, Milwaukee, Richmond, and San Jose.
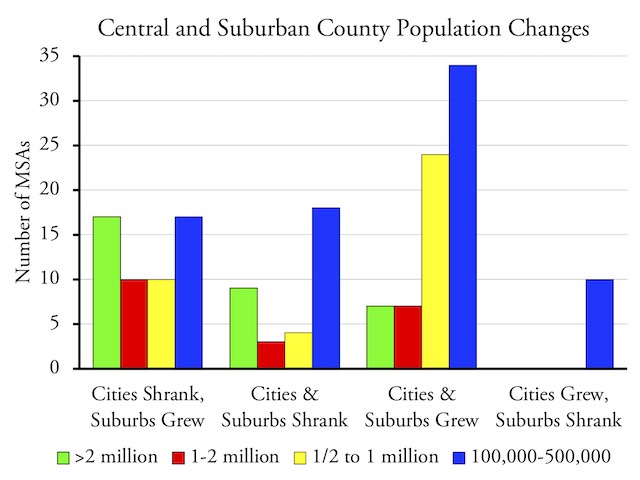
The biggest cities mostly shrank and small cities mostly grew in 2021, while suburbs were split.
Second, the correlation between central county decline and housing prices is weak. Atlanta, Dallas, and Houston all have low housing prices, yet their central counties declined. Meanwhile, housing prices are high in Riverside, San Bernardino, and Sacramento, yet their populations grew.
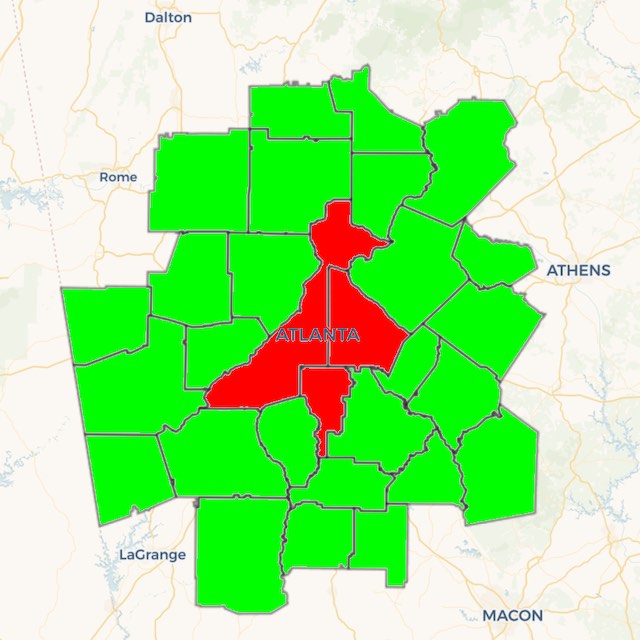
Although Atlanta has some of the most affordable housing in the nation, populations declined in the denser central counties where the city itself is located but grew in all of its suburban counties.
Third, the few big cities grew tended to be sunbelt cities whose densities are low and don’t have traditional downtowns—in other words, cities that look like suburbs. This includes Phoenix, Riverside, Tampa, and San Antonio in MSAs of more than 2 million, and Jacksonville, Oklahoma City, Raleigh, and Tulsa in MSAs of 1 to 2 million people.

Red shows counties whose population declined in 2021; green shows ones that grew. Although housing prices are high throughout California, populations declined mainly in the counties with the densest urban areas.
Fourth, the suburbs in MSAs with high housing prices, such as Boston, Los Angeles, New York, and San Francisco, are also declining. Every county in the San Francisco MSA lost population. This could be due to the high housing prices, but in most places prices are high because state or local policies have emphasized high-density residential development, so the declines could also be due to a reaction to the other problems with density.
Fifth, the suburbs in MSAs with more affordable housing, including Atlanta, Dallas, and Houston, almost all grew in population. These suburbs tend to have few land-use restrictions aimed at promoting dense development; instead, a relatively free market allows people to choose the densities they prefer.
Finally, most MSAs smaller than 1 million people grew. My dataset includes 117 MSAs with 50,000 to 1 million residents; 58 percent of their central cities and 80 percent of their suburbs grew in population. Only a few regions saw their central counties grow while suburban counties declined, and none of these were larger than 500,000 residents. Many of these may be cases where the central counties do not work well as a proxy for the central cities, as the county may contain large suburban areas that grew faster than the central city declined.
Why Are People Leaving Cities?
Americans began leaving cities in 2020 due to fears of infection from COVID-19. But then something happened: many people found they could work at home more productively than they could by commuting to an office or other work site. Even if they still had to go to an office a few days a week to meet with co-workers, they could live further away from that office and still spend less time commuting than they had before the pandemic.
Many people were already unhappy with living in cities before the pandemic. A fall 2018 Gallup survey found that 20 percent of Americans lived in big cities but only 12 percent wanted to live there. Meanwhile, 31 percent wanted to live in the suburbs but only 26 percent lived there, and 27 percent wanted to live in rural areas, but only 15 percent actually lived in such areas.
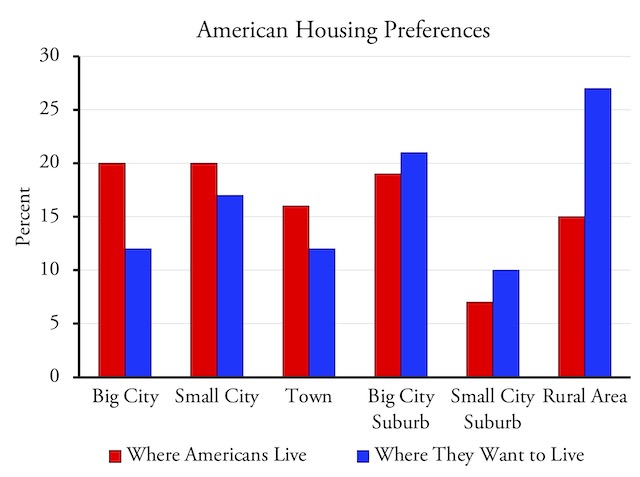
A 2018 Gallup poll found that more Americans lived in cities and towns than wanted to live there while more Americans wanted to live in suburbs and rural areas than actually lived there.
The pandemic gave many people the opportunity to live where they wanted to live instead of close to where their employers wanted them to work. All they had to do was convince their employers that had been more productive working at home during the pandemic—or find another employer who would allow them to continue doing so. When some employers resisted, people responded with the Great Resignation: large scale departures from jobs people no longer found fulfilling, partly due to the cost of commuting.
Some have attributed the recent migration to high taxes and housing costs, but that’s only part of the answer. The data show that people are leaving both the central cities and the suburbs of regions with high housing costs, such as Los Angeles, New York, and San Francisco. However, people are also leaving the central cities, but not the suburbs, of regions with more affordable housing, such as Atlanta, Dallas, and Houston. People are attracted to central cities whose densities are so low that they are essentially suburban, such as Phoenix, Tampa, and San Antonio.
In short, costs are an issue, but density is also a major factor: people want to live in low-density areas, whether cities if they are low in density, low-density suburbs, or exurbs. People are moving out of the densest central cities, whether they are unaffordable such as New York, Los Angeles, and San Francisco or more affordable such as Atlanta, Dallas, and Houston. People are moving to central cities whose densities are low, such as Phoenix, Tampa, and San Antonio. They are moving to suburbs if their densities are low but they are avoiding the denser suburbs around cities such as New York, Los Angeles, and San Francisco. This is exactly the opposite of what urban planners have been saying for the last few decades.
Professor Nelson’s Questionable Prediction
In 2006, a University of Utah urban planning professor named Arthur Nelson (who has since moved to the University of Arizona) wrote a paper for the Journal of the American Planning Association predicting that, by 2025, Americans would want 26 million new units of dense housing while 22 million units of existing low-density suburban housing would go unwanted. American suburbs were going to turn to slums. To prevent this, he said, urban planners should take the lead by convincing urban governments to give developers incentives to build new high-density housing and discourage new low-density development.
Nelson failed to describe in detail how he came up with these numbers, instead simply crediting them to “author’s analysis.” He did cite a paper by two planners from the University of Southern California that looked at housing preferences. The paper reviewed numerous surveys that found that anywhere from 73 to 83 percent of Americans preferred detached single-family homes. But Nelson claimed that his “interpretation” of these surveys was that more Americans in the future would prefer multifamily.
Urban planners leaped on Nelson’s conclusions with joy, as it fit their preconceived notions that Americans should live in higher densities. As a planner named Douglas Porter had written in 1991, there was a “gap between the daily mode of living desired by most Americans and the mode that most city planners . . . believe is most appropriate,” namely that Americans “want a house on a large lot and three cars in every garage” while planners wanted denser development. Being firmly on the side of planners, Porter urged regional governments to restrict low-density development.
That happened in a few places, notably California, Oregon, and Washington. In most of the rest of the country, however, most elected officials still believed that the personal desires of Americans to live in single-family homes should prevail over urban planning ideologies. Nelson’s article gave planners the ammunition to argue for density: although Americans in 2006 primarily lived in low densities, young people and retiring baby boomers were supposedly going to want to live in high-density cities.
Nelson’s claims seemed to gain support from the 2010 census, which found that at least some major cities had grown faster, on a percentage basis, than their suburbs. Numerically, however, the suburbs were still growing faster. By 2014, census data revealed that the growth spurt of big cities, if there was one, was short lived: far from growing faster than their suburbs, most of the nation’s biggest cities were declining in population.
This didn’t stop planners at the Twin Cities Metropolitan Council from hiring Nelson to predict the future demand for housing in that region. In his 2014 report, Nelson somehow calculated that, by 2040, the region would need 193,000 new units of attached or multifamily housing, while the demand for single-family detached homes on large lots would decline by 22,000 units. Once again, his only reference for these claims was to himself.
Nelson’s predictions were strangely specific in an uncertain world. Though 2040 was 26 years away, he confidently predicted that the region would need exactly 193,000 new units of new multifamily housing, not 192,000 or 194,000. His actual wording was that households in 2040 would “demand” 193,000 units of new dense housing. Economically, demand is never a single point, such as 193,000. Instead, it is a relationship between price and quantity: for most goods, when prices are lower, the quantity that people will buy is higher. But Nelson never specified the prices he assumed to make his predictions and it is likely that he didn’t use any and was simply misusing the term. The region’s planning agency, the Metropolitan Council, wanted to base the entire future of the Twin Cities region on someone who didn’t understand the basic law of supply and demand.
Nelson’s claim that the demand for single-family homes was declining while the demand for multifamily was increasing probably figured into the decision by the city of Minneapolis to abolish single-family zoning in 2018. After all, if there were going to be 22,000 surplus single-family homes, they could be torn down and replaced with multifamily homes, but only if single-family neighborhoods were rezoned to allow for such replacements.
Developers Work Best Without Planners’ Interference
Developers are smarter than planners assume. The survival of their businesses depends on them building products that people want. They also know that, above two stories, multifamily buildings cost a lot more to build, per square foot, than low-rise single-family housing due to the need for elevators, concrete fire-proof layers between floors, and structural steel to hold it all up.
In 2005, I met a developer who had built several multifamily buildings in Minneapolis. I asked him what was the main factor inspiring him to build one of them. “Probably the $5 million in subsidies the city gave me,” he said. It turned out that all his multifamily projects were subsidized. He did show me plans for a large multifamily, mixed-use project he was proposing to build without subsidies. Years later I asked how it went. “It never got built,” he ruefully replied. “It turns out that, without subsidies, there isn’t much demand for that kind of housing.”
Today, it is clear that Nelson’s predictions were not just wrong, they were spectacularly wrong. Of course, Nelson couldn’t have predicted the coronavirus pandemic. But he willfully ignored or, in his own mind, “reinterpreted,” numerous surveys and polls that found that more than 70 percent of Americans preferred single-family housing. Today, just three years before Nelson’s prediction of a 22-million surplus of suburban homes, there is absolutely no sign of such a surplus. Instead, suburban home prices are rising faster than ever, while if anything there is a surplus of multifamily housing in major cities.
A large part of the recent rise in suburban housing prices is due to planning regulations imposed by cities, states, and regional governments taken in by Nelson’s absurd claims. These regulations limited the construction of new single-family homes and gave developers incentives to build more multifamily housing. If anything, it will be the multifamily housing that will turn into slums as the rents people are willing to pay for them won’t be enough to support the loans developers took out to build them plus maintenance and upkeep.
This analysis can be refined when the Census Bureau publishes estimates for 2021 city populations and even further when it publishes estimates for urban areas, which include only the urbanized portions of MSAs. Even before that refinement, however, it is clear that Americans are unhappy with dense cities and suburbs and many are leaving those areas for lower-density places.


Lefties are fleeing Cities. NO you stay in the cities you ruined.
Just makin’ shit up or mindlessly repeating made up shit.
It’s more likely that conservatives and libertarians are fleeing in larger numbers.
In Nov. 2013, 38.2% of registered voters in Idaho identified as Republican, while registered Democrats made up 7.6% of voters. Almost six years later, Republicans now have 50.8% of total registered voters in Idaho, an increase of 12.6%. The number of registered Democrats this year is now at 12.7%, up by 5.1% from 2013. The number of registered Republicans in Idaho has grown by over 206,000 in the last six years and there are only about 52,000 more registered Democrats in Idaho. These changes show that the state’s population growth is only leading to an increasingly Republican-leaning Idaho.
I wonder what sort of house Arthur Nelson lives in? My experience with planning professors who advocate high density housing is that they actually live in single family homes. Policies based on hypocrisy are doomed to failure.
Whitepages and Zillow shows he lives in Tuscon in a four bedroom, 2.5 bath, 4,040 square foot single family home on 0.84 acres with a pool and a three-car garage. It’s on a country club golf course. He bought it in 2014 for a million dollars. It’s in the elite suburb of Catalina Foothills, which is on the edge of the metro area adjacent to a national forest and is a 25 minute drive to the University of Arizona. It has a walk score of three, putting it firmly in the “Car-Dependent” category, which means “Almost all errands require a car.”
Public transit for thee but not for me.
There may have been a moment were Nelson’s predictions were noticed by a few in Minneapolis, I’m skeptical that it played a meaningful role in Minneapolis’ changes for 2 reasons:
a) The ( unelected ) Met Council doesn’t seem to have any sticks or carrots to use on Minneapolis to not remove SFH zoning. In fact, Met Council has spent the last few decades using laws, carrots and sticks to get suburban cities to add density. For example, check out their dragged out legal fight with Lake Elmo.
b) Urbanistas seem to have largely glommed onto the rhetoric that more units will ( magically ) create lower housing prices. I’m not sure 10 years I was hearing any of them talking about not needing more SFHs. I don’t doubt some where there. Not so sure that’s a meaningful reason they used.