
After adjusting for inflation, the nationwide median price of housing exceeded median prices during the 2006 housing bubble for the first time in early 2021, according to home price index data published by the Federal Housing Finance Agency. Zillow agrees: though Zillow says its price index is for the “typical” house rather than the median home, its inflation-adjusted price for single-family homes peaked in November 2006 at $295,000, then fell below $200,000 in 2012. The typical price then crept above $295,000 in December 2020. As of March 2022, it had grown to $338,000, an inflation-adjusted increase of 22 percent since the beginning of the pandemic.
 Click image to download a four-page PDF of this policy brief.
Out of 660 metropolitan (areas with more than 50,000 people) and micropolitan (areas with populations of 2,500 to 50,000) areas tracked by Zillow, March 2022 housing prices exceeded the inflation-adjusted 2006-2008 peak in all but about 170. Major urban areas where prices had not yet reached the peak of the bubble include New York, Chicago, Washington, Baltimore, Minneapolis-St. Paul, and St. Louis. But prices in Atlanta, Charlotte, Dallas, Houston, and San Antonio are all well above their 2006-2008 peaks, not that any of these regions experienced much of a peak.
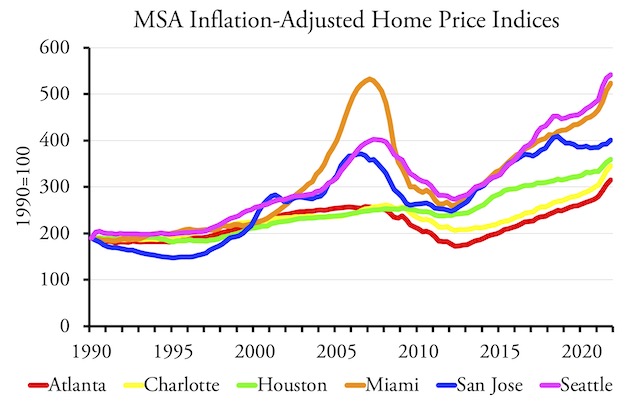
Prices today are rising almost everywhere, including regions that didn’t see much a housing bubble in the 2000s as well as those that did. Note that prices in San Jose and Seattle both declined slightly before the pandemic, but have grown since then. Source: Federal Housing Finance Agency.
Unlike the previous housing bubble, where prices rose only in states and regions whose growth-management policies had created artificial land shortages, today’s prices are rising almost everywhere. This is partly because far more people are moving than ever before, which is putting pressure on housing supplies in many places. While a lot of people made temporary moves in 2020, only 2 percent more people permanently moved in 2020 than 2019. In 2021, however, moving rates grew by 20 percent.
These numbers raise several important questions. Why are prices rising so fast? Will rising prices make housing unaffordable everywhere in the country? What role do rising prices play in inflation rates? Are rising prices a sign of another housing bubble that could lead to another economic crisis?
Metro Area Home Values, Value-to-Income Ratios, and Population Growth
| Typical Home Value March 2022 | Value-to-Income | Value Growth Since February 2020 | 2020 Population | 2021 Population Growth | |
|---|---|---|---|---|---|
| Pittsburgh | 210,762 | 2.2 | 16.0% | 2,367,293 | -0.58% |
| Oklahoma City | 208,821 | 2.4 | 15.9% | 1,428,709 | 0.91% |
| St. Louis | 239,564 | 2.5 | 15.5% | 2,818,267 | -0.32% |
| Cleveland | 213,927 | 2.5 | 18.2% | 2,085,357 | -0.47% |
| Detroit | 232,954 | 2.6 | 17.4% | 4,385,748 | -0.47% |
| Cincinnati | 257,861 | 2.6 | 19.6% | 2,257,667 | 0.10% |
| Buffalo | 236,089 | 2.7 | 20.6% | 1,165,506 | -0.27% |
| Birmingham | 231,749 | 2.7 | 18.2% | 1,114,710 | -0.04% |
| Indianapolis | 262,284 | 2.8 | 24.0% | 2,113,700 | 0.62% |
| Louisville | 236,032 | 2.8 | 14.3% | 1,285,058 | -0.04% |
| Omaha | 265,050 | 2.8 | 14.3% | 968,493 | 0.33% |
| Milwaukee | 268,860 | 2.8 | 15.9% | 1,573,598 | -0.45% |
| Memphis | 219,952 | 2.8 | 24.1% | 1,337,311 | -0.09% |
| Chicago | 307,541 | 2.9 | 12.4% | 7,252,081 | -0.96% |
| Kansas City | 279,765 | 2.9 | 19.8% | 2,193,578 | 0.27% |
| Hartford | 328,759 | 2.9 | 16.2% | 1,211,505 | 0.03% |
| El Paso | 184,658 | 3.1 | 19.7% | 869,289 | 0.22% |
| Columbus | 298,738 | 3.1 | 19.1% | 2,141,042 | 0.47% |
| Philadelphia | 327,813 | 3.1 | 15.8% | 2,177,393 | -0.21% |
| Richmond | 319,057 | 3.2 | 13.5% | 1,315,734 | 0.64% |
| Minneapolis | 376,415 | 3.2 | 12.1% | 3,692,421 | -0.05% |
| Baltimore | 374,406 | 3.2 | 11.1% | 2,841,691 | -0.12% |
| New Orleans | 264,573 | 3.2 | 12.3% | 1,270,366 | -0.68% |
| Houston | 297,130 | 3.3 | 19.4% | 7,137,747 | 0.97% |
| Virginia Beach | 330,346 | 3.4 | 14.4% | 1,800,081 | 0.18% |
| Bridgeport | 650,148 | 3.6 | 18.5% | 955,895 | 0.41% |
| Atlanta | 364,852 | 3.8 | 32.5% | 6,101,146 | 0.70% |
| San Antonio | 323,892 | 3.8 | 23.0% | 2,566,683 | 1.37% |
| Charlotte | 367,737 | 3.8 | 44.2% | 2,669,665 | 1.18% |
| Dallas | 373,789 | 3.8 | 29.1% | 7,662,325 | 1.34% |
| Albuquerque | 301,665 | 3.9 | 25.2% | 917,179 | 0.12% |
| Raleigh | 435,963 | 4.0 | 35.9% | 1,420,225 | 1.99% |
| Washington | 572,668 | 4.0 | 12.2% | 5,051,734 | -0.46% |
| Jacksonville | 351,034 | 4.1 | 32.6% | 1,611,388 | 1.63% |
| Tucson | 337,027 | 4.2 | 32.2% | 1,045,599 | 0.62% |
| Nashville | 428,008 | 4.4 | 32.2% | 1,995,343 | 0.86% |
| Tampa | 366,790 | 4.5 | 39.4% | 3,183,385 | 1.12% |
| Providence | 442,852 | 4.5 | 21.3% | 1,675,401 | 0.02% |
| Orlando | 379,358 | 4.7 | 27.2% | 2,677,687 | 0.53% |
| Boston | 664,717 | 4.7 | 17.2% | 2,052,435 | -1.15% |
| Phoenix | 461,499 | 5.2 | 42.9% | 4,867,925 | 1.60% |
| Austin | 596,673 | 5.4 | 56.4% | 2,299,125 | 2.29% |
| Portland | 580,389 | 5.5 | 21.2% | 2,516,230 | -0.18% |
| Las Vegas | 445,492 | 5.5 | 31.8% | 2,273,386 | 0.84% |
| Denver | 651,807 | 5.5 | 26.0% | 2,969,289 | 0.11% |
| Salt Lake | 611,548 | 5.9 | 36.7% | 1,259,517 | 0.28% |
| Miami | 488,923 | 6.0 | 26.2% | 2,692,459 | -0.57% |
| Seattle | 806,532 | 6.0 | 30.5% | 4,024,730 | -0.33% |
| Sacramento | 614,403 | 6.0 | 25.5% | 2,399,351 | 0.50% |
| New York | 599,480 | 6.3 | 12.7% | 12,412,533 | -1.63% |
| Riverside | 577,501 | 6.6 | 32.7% | 4,605,504 | 1.03% |
| Boulder | 840,063 | 6.7 | 23.3% | 330,811 | -0.38% |
| San Diego | 954,402 | 8.9 | 34.5% | 3,297,252 | -0.34% |
| San Francisco | 1,538,189 | 9.2 | 17.9% | 1,632,467 | -2.46% |
| Honolulu | 1,092,990 | 9.6 | 18.4% | 1,013,227 | -1.22% |
| Los Angeles | 957,514 | 10.5 | 21.0% | 13,173,266 | -1.34% |
| San Jose | 1,778,721 | 10.6 | 21.5% | 1,995,105 | -2.15% |
This table presents data for every U.S. metro area with more than 1 million people plus a few others that are interesting (at least to me) such as Boulder and Albuquerque.
Demand Swamps Supply
There are three principal reasons why prices are rising so fast. First, supply-chain problems have pushed up the price of building materials. Second, COVID-related labor shortages have impaired the construction industry’s ability to build large numbers of new homes. Both of these reduced the capacity of home builders to meet demand. Finally, these problems are compounded in some areas by dramatic growth rates that totally swamped the home construction industry.
For example, in the decade before the pandemic, the Houston metro area soaked up nearly 125,000 new residents per year. In 2021, however, the region saw a net increase of less than 70,000 people. Home prices grew by 19 percent, a little less than the national average, and in March Zillow’s typical house still cost less than $300,000, significantly less than most other major urban areas. Austin, however, saw almost as many new residents in 2021 as its average growth rate in the previous decade. During the pandemic, typical home prices there leaped by 56 percent to a stunning (for Texas) $597,000.
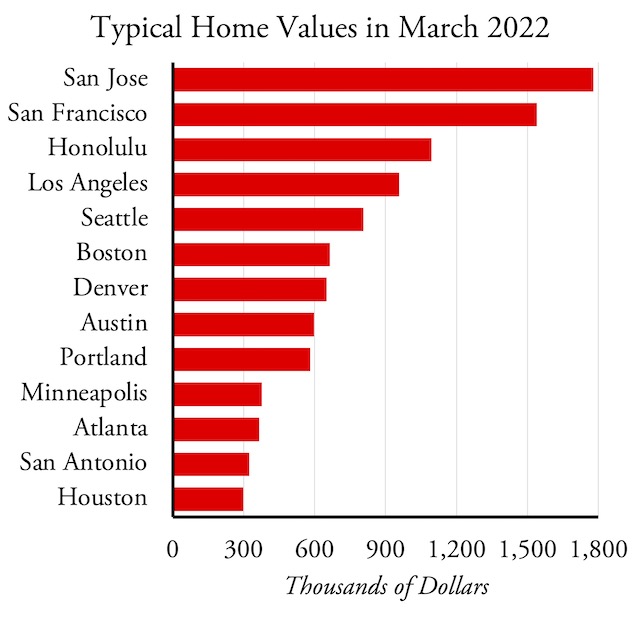
Typical home values in American urban areas range from under $300,000 to nearly $2.0 million. Source: Zillow.
One factor that is not an issue, except for where local growth-management planning has made it one, is land. Contrary to claimsoften repeated by the media, every state and every urban area in the United States has plenty of vacant land to support new housing. Urban-growth boundaries and similar policies have created artificial land shortages, but they could be relieved in an instant by abolishing the boundaries.
Still, these artificial land shortages continue to push up prices even in places that are losing population. Inflation-adjusted prices in both San Francisco and San Jose declined between 2018 and 2020, and yet they rose during the pandemic despite the fact that the San Francisco metro area lost 117,000 people and San Jose lost 43,000 in 2021. The Los Angeles metro area lost 176,000 residents yet prices rose 21 percent. Boston lost 36,000 people yet prices rose 17 percent. Similarly contrary trends are found in Chicago, Miami, New York, and several other major urban areas. All these increases are less than the national average but that they are increases at all seems strange in the face of declining populations.
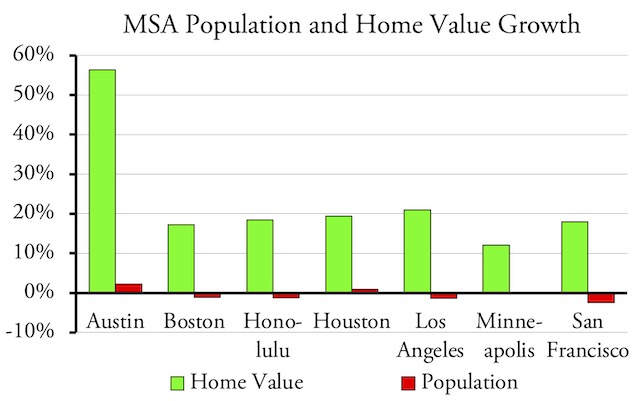
Home prices seemed to increase regardless of population growth. To be fair, the growth in home prices shown here is from February 2020 to March 2022 while the population growth is from July 2020 to July 2021. Source: Zillow & Census Bureau.
Many Areas Remain Affordable
Only about a dozen of the nation’s 50 largest urban areas are less costly than Zillow’s typical price of $338,000 for the nation as a whole. Chief among them is Houston at $297,000. Others include Chicago, Philadelphia, San Antonio, Virginia Beach, Richmond, Columbus, Kansas City, Milwaukee, Indianapolis, Cincinnati, St. Louis, and Cleveland.
When compared with local median incomes, most places are growing less affordable as housing prices are rising much faster than incomes. Depending on interest rates, homebuyers can pay off a mortgage in less than 15 years if the home costs less than three times their income and in less than 30 years if it costs less than four times their income. If it costs more than five times their income, they may not be able to buy the home under standard mortgage rules that limit payments to less than 30 percent of incomes.
Based on this, regions with median home prices that are less than three times median family incomes are very affordable; three to four times is affordable; four to five times is marginally affordable; and more than five times is unaffordable. Of course, some people will be able to buy homes in an unaffordable region, but most will not, leading to major stress on people’s budgets.
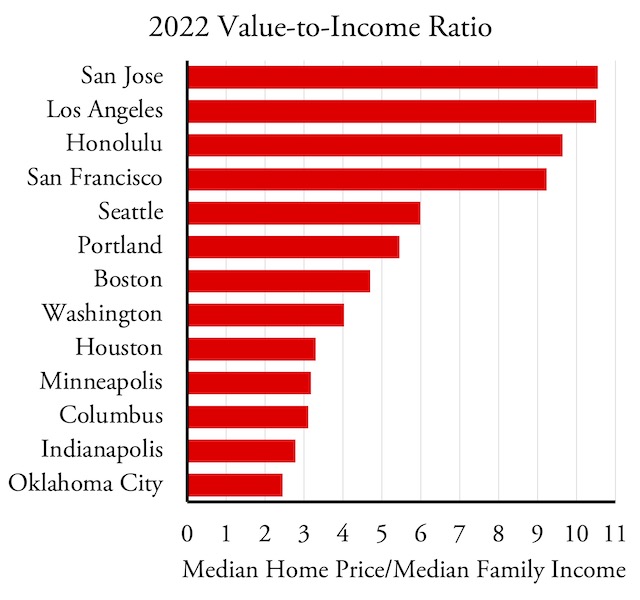
Median home value to median family income ratios in major American urban areas range from a little more than 2 to almost 11. Source: Zillow, HUD for median income data.
Most places in California and Hawaii, which have the nation’s strictest growth-management rules, have been in the unaffordable range (value-to-income ratios above 5) for years, as has Boulder, Colorado. This year, they are joined by Austin, Denver, Las Vegas, Miami, Phoenix, Portland, Salt Lake City, and Seattle, as well as many smaller urban areas including Bend, Bozeman, Flagstaff, Fort Collins, Grants Pass, Missoula, and Spokane.
Note that nearly all these places also have strict growth-management plans. One that should not, however, is Austin. The city of Austin has a slow-growth/no-growth policy, but its suburbs do not yet many of them have prices in the upper $500,000s. Texas counties aren’t even allowed to regulate growth, so developers should be able to build new homes outside of incorporated areas if all the cities in the region restrict growth. It is possible that prices are high because the people who are buying homes in the region are coming from high-priced states such as California and so they either have the equity or the incomes to afford homes that are more expensive than most local residents could afford.
Boston leads the list of metropolitan areas in the marginally unaffordable range (value-to-income ratios between 4 and 5), though with a value-to-income ratio of 4.7 it wouldn’t take much to make it unaffordable. Other regions in this range include Tampa, Nashville, Jacksonville, Tucson, Charleston, and Billings.
In addition to Houston, urban areas that remain affordable (value-to-income ratios between 3 and 4) include Albuquerque, Atlanta, Charlotte, Dallas-Ft. Worth, Grand Rapids, Madison, Minneapolis-St. Paul, Philadelphia, San Antonio, and Virginia Beach. Metro areas that are very affordable (value-to-income ratios below 3) include Chicago, Cincinnati, Cleveland, Indianapolis, Milwaukee, Pittsburgh, and St. Louis. Of course, most of these rust-belt cities are losing population, but some that are not and yet remain very affordable include Amarillo, Louisville, Oklahoma City, Omaha, and Tulsa.
Housing and Inflation
The annual inflation rate in March 2022 was 8.5 percent, the highest since 1981. Nearly one-third of the consumer price index (which I used to adjust past housing prices for inflation) is based on housing costs. Yet some economists believe that the Bureau of Labor Statistics, which calculates the consumer price index, underestimates housing inflation. To measure housing prices, the agency calculates the rental equivalence of the cost of homeownership. This doesn’t increase nearly as fast as sale prices. This is not, however, necessarily an error.
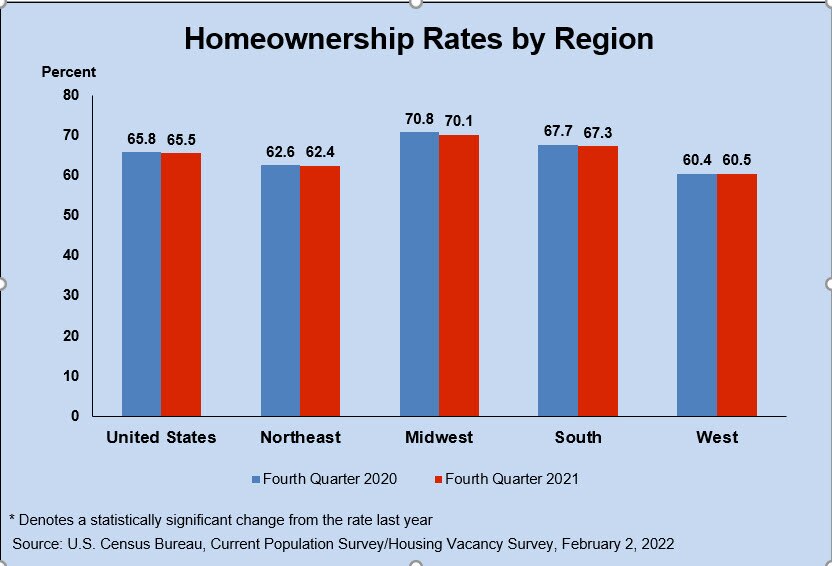
Nearly two-thirds of American households own their own homes, and few buy new ones every year. Those who already own their homes are insulated from increases in home prices. In the current market, many people are moving from high-cost areas to lower-cost areas, which means their housing costs are declining. For the one-third of people who don’t own their homes, rents in the most-expensive markets are declining as many people move to less-expensive markets, resulting in an overall decline in nationwide rents in 2021.
Housing, therefore, forms only a small part of that 8.5 percent inflation rate. Inflation, however, plays a major role in increased housing prices. The afore-mentioned material and labor shortages increase the costs of new housing. More important, many of the trillions of dollars the federal government gave out in COVID relief funds found its way into consumers’ pockets, allowing them to spend more on new homes, partly by buying larger or more luxurious homes but also by bidding up the prices of those homes that were on the market. This pushed up new home prices and allowed owners of existing homes to raise the prices of homes they were willing to sell.
A New Bubble?
The homevoter hypothesis suggests that, since most Americans own their homes, they aren’t truly interested in making housing more affordable because rising prices increases their apparent wealth. This may be one reason why politicians focus on affordable housing programs that don’t make housing more affordable (and may even make it less affordable) rather than ending the growth-management policies that make housing expensive. The risk these homeowners face is that land-use policies that create artificial housing shortages not only make housing more expensive, they make housing prices much more volatile than they had been before states and regions began practicing growth management in the 1970s through the 1990s.
The 2008 financial crisis happened because investment ratings agencies—Standard & Poor’s, Moody’s, and Fitch—failed to recognize this new volatility in housing markets and therefore underestimated the riskiness of mortgage investments. As prices began to falter in 2006, the agencies downgraded their ratings of such mortgages. This created a problem for the banks holding those mortgages, as they are required to keep cash on hand that is proportional to the riskiness of the investments they make. Triple-A investments might require 0.5 percent cash, but B investments might require 8 percent cash. When the agencies downgraded mortgages, the cash reserve requirements for many banks suddenly rose by billions of dollars. Lehman Brothers couldn’t raise that cash overnight and went out of business. CitiBank, Washington Mutual, and many other major banks threatened to follow.
As today’s material and labor shortages are resolved and homebuilders gear up to meet the demand for new housing in many areas, home prices are likely to decline somewhat in those areas. But this is not going to create the kind of financial collapse that happened in 2008 because the banks and ratings agencies have learned their lesson about housing volatility.
Sadly, the markets where prices are most likely to decline are those with the least growth-management regulation. The fact that prices continue to increase in San Francisco, San Jose, and other cities that are losing population demonstrates that growth management has a vicious hold on these housing markets. Since not even many libertarian groups seem interested in fixing this problem, the United States is likely to be a country with two completely different kinds of housing markets, one that is artificially constrained by government policy and one that is free to grow.
In the long run, prices in the constrained markets are bound to collapse, as they did in 2006 and many did in the late 1970s and early 1990s. This will cause financial losses for some but will not threaten the economy as a whole.
One thing is clear. If today’s rising prices are due to supply-chain issues and labor shortages, then high prices are not going to be fixed by building denser housing or government subsidies to affordable housing. In fact, such policies will make the single-family housing most Americans want even less affordable by diverting scarce materials and labor into multifamily housing that most Americans don’t want. The best thing politicians can do is to keep their hands off the housing industry, as that industry has proven itself capable of meeting all housing demand so long as the government doesn’t interfere.


