
The share of land in the United States that is urbanized grew from 2.90 percent in 2010 to 2.94 percent in 2020, according to data recently released by the Census Bureau showing how many square miles of land in each state was urbanized as of 2020. This can be compared with 2010 data and the total land area of each state to calculate what percentage had been urbanized in each of the two years.
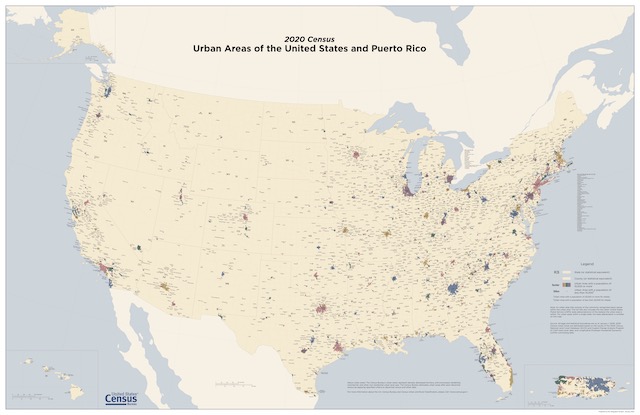
Click image to download a 15.0-MB PDF of this map distinguishing urban from rural areas in 2020.
One reason why the growth was so small was that the Census Bureau redefined urban; under the old definition, any community of 2,500 people was urban; under the new definition, communities had to have 5,000 people or 2,000 residences. However, this only makes a small difference — perhaps 0.1 percent — because such communities are, by definition, small.
The main reason for the small growth of urban areas is that the demographic forces that contributed to such urbanization — growing population, shrinking average family size, and the movement of people from rural to urban areas — have all slowed or halted. That’s why you don’t hear much fretting about urban sprawl anymore; instead, climate change has become the crisis du jour for trying to force people to live in ways they don’t want to live.
2010 and 2020 Urban Lands and Densities
| 2020 Urban Land | 2010 Urban Land | 2020 Urban Pop | 2010 Urban Pop | 2020 Urban Density | 2010 Urban Density | |
|---|---|---|---|---|---|---|
| Alabama | 4.1% | 4.4% | 57.7% | 59.0% | 1,386 | 1,279 |
| Alaska | 0.1% | 0.0% | 64.9% | 66.0% | 1,467 | 1,803 |
| Arizona | 1.9% | 1.9% | 89.3% | 89.8% | 2,951 | 2,625 |
| Arkansas | 2.1% | 2.1% | 55.5% | 56.2% | 1,536 | 1,493 |
| California | 5.0% | 5.3% | 94.2% | 95.0% | 4,790 | 4,304 |
| Colorado | 1.5% | 1.5% | 86.0% | 86.2% | 3,150 | 2,836 |
| Connecticut | 34.6% | 37.7% | 86.3% | 88.0% | 1,859 | 1,722 |
| Delaware | 22.0% | 20.9% | 82.6% | 83.3% | 1,903 | 1,838 |
| District of Columbia | 100.0% | 100.0% | 100.0% | 100.0% | 11,281 | 9,856 |
| Florida | 14.8% | 13.8% | 91.5% | 91.2% | 2,479 | 2,315 |
| Georgia | 8.1% | 8.3% | 74.1% | 75.1% | 1,702 | 1,516 |
| Hawaii | 4.7% | 6.1% | 86.1% | 91.9% | 4,142 | 3,181 |
| Idaho | 0.6% | 0.6% | 69.2% | 70.6% | 2,662 | 2,217 |
| Illinois | 6.7% | 7.1% | 86.9% | 88.5% | 3,007 | 2,878 |
| Indiana | 6.8% | 7.0% | 71.2% | 72.4% | 1,991 | 1,860 |
| Iowa | 1.7% | 1.7% | 63.2% | 64.0% | 2,062 | 2,046 |
| Kansas | 1.2% | 1.2% | 72.3% | 74.2% | 2,176 | 2,176 |
| Kentucky | 3.5% | 3.6% | 58.7% | 58.4% | 1,918 | 1,796 |
| Louisiana | 4.5% | 4.6% | 71.5% | 73.2% | 1,708 | 1,686 |
| Maine | 1.3% | 1.2% | 38.6% | 38.7% | 1,303 | 1,428 |
| Maryland | 18.8% | 20.7% | 85.6% | 87.2% | 2,893 | 2,511 |
| Massachusetts | 37.1% | 38.3% | 91.3% | 92.0% | 2,219 | 2,016 |
| Michigan | 6.2% | 6.4% | 73.5% | 74.6% | 2,107 | 2,034 |
| Minnesota | 2.1% | 2.1% | 71.9% | 73.3% | 2,491 | 2,279 |
| Mississippi | 2.2% | 2.4% | 46.3% | 49.3% | 1,348 | 1,324 |
| Missouri | 3.0% | 3.0% | 69.5% | 70.4% | 2,102 | 2,053 |
| Montan | 0.2% | 0.2% | 53.4% | 55.9% | 1,982 | 1,861 |
| Nebraska | 0.7% | 0.7% | 73.0% | 73.1% | 2,640 | 2,549 |
| Nevada | 0.7% | 0.7% | 94.1% | 94.2% | 3,715 | 3,315 |
| New Hampshire | 7.0% | 7.2% | 58.3% | 60.3% | 1,274 | 1,233 |
| New Jersey | 37.3% | 39.7% | 93.8% | 94.7% | 3,178 | 2,851 |
| New Mexico | 0.6% | 0.7% | 74.5% | 77.4% | 2,143 | 1,929 |
| New York | 8.1% | 8.7% | 87.4% | 87.9% | 4,645 | 4,161 |
| North Carolina | 9.3% | 9.5% | 66.7% | 66.1% | 1,540 | 1,367 |
| North Dakota | 0.3% | 0.3% | 61.0% | 59.9% | 2,208 | 2,192 |
| Ohio | 10.3% | 10.8% | 76.3% | 77.9% | 2,140 | 2,034 |
| Oklahoma | 1.9% | 1.9% | 64.6% | 66.2% | 1,987 | 1,902 |
| Oregon | 1.1% | 1.2% | 80.5% | 81.0% | 3,209 | 2,805 |
| Pennsylvania | 9.3% | 10.5% | 76.5% | 78.7% | 2,381 | 2,123 |
| Rhode Island | 36.7% | 38.8% | 91.1% | 90.7% | 2,631 | 2,384 |
| South Carolina | 8.1% | 7.9% | 67.9% | 66.3% | 1,433 | 1,288 |
| South Dakota | 0.3% | 0.3% | 57.2% | 56.7% | 2,066 | 2,038 |
| Tennessee | 7.0% | 7.0% | 66.2% | 66.4% | 1,585 | 1,450 |
| Texas | 3.5% | 3.3% | 83.7% | 84.7% | 2,696 | 2,435 |
| Utah | 1.1% | 1.1% | 89.8% | 90.6% | 3,119 | 2,737 |
| Vermont | 1.5% | 1.7% | 35.1% | 38.9% | 1,595 | 1,559 |
| Virgina | 6.7% | 6.7% | 75.6% | 75.5% | 2,471 | 2,265 |
| Washington | 3.5% | 3.6% | 83.4% | 84.0% | 2,752 | 2,380 |
| West Virginia | 2.2% | 2.7% | 44.6% | 48.7% | 1,483 | 1,410 |
| Wisconsin | 3.3% | 2.8% | 67.1% | 67.0% | 2,232 | 2,105 |
| Wyoming | 0.2% | 0.2% | 62.0% | 64.8% | 2,024 | 1,876 |
| United States | 2.94% | 2.90% | 80.0% | 80.9% | 2,553 | 2,346 |
Thanks to its strict land-use regulation, including urban-growth boundaries that are nearly impossible to adjust, California still has the densest urban areas of any state in the nation. In fact, the state packs more than 94 percent of its population into just 5 percent of its land area, an urban concentration found in no other state.
Despite claims that increasing densities are the solution to housing affordability problems, the states with the densest urban areas tend to be least affordable and their affordability declines as they get denser. California has the least affordable housing in the country, and other states with dense urban populations, including Hawaii, New Jersey, New York, and Oregon, are also among the least affordable. Few if any urban areas whose densities are below 3,000 people per square mile have problems with high housing prices.
Going one more digit past the decimal point than shown in the above table, the Census Bureau defines 1.11 percent of Oregon as urban, down from 1.15 percent in 2010, probably due to the elimination of small communities from the definition of urban. Even 1.15 percent is hardly cause for panic, yet — as I noted here yesterday — state legislators act as if it is imperative that the state keep its system of urban-growth boundaries.
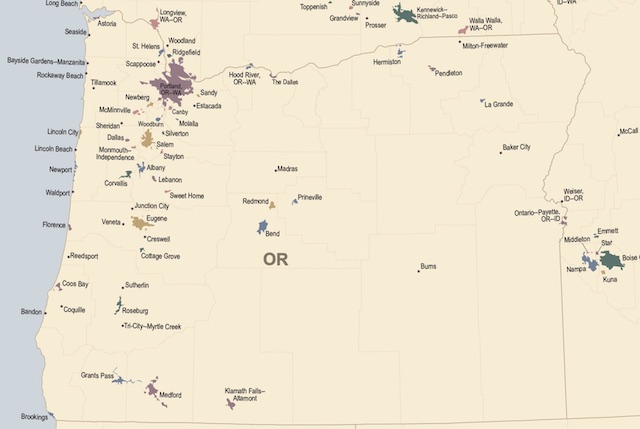
Oregon is hardly being overrun by urban sprawl.
Oregon’s Willamette Valley occupies about one-seventh of the state, yet it houses two-thirds of its population. Urban areas cover less than 4.9 percent of the valley at an average density of nearly 3,900 people per square mile. If the growth boundaries were abolished, urbanization would probably expand to cover another 1.5 percent of the valley, which would allow densities to fall below 3,000 people per square mile.
Thus, Oregon’s mania for trying to make housing affordable by sweeping aside personal preferences in favor of soviet-style, top-down planning targets isn’t going to make housing more affordable. It’s just going to make the state less livable.


Without thinking much about it, most people prefer traditional architecture. It’s nit an urban problem it’s a aesthetic issue. City evokes bland concrete, Portland thars whatbthey got.
Now it seems as if more detailed and ornamental styles of design for buildings and cities are not only more popular but more natural and more healthy. These designs evoke buidings, never more than a few stories. Moderate density capacities where walkability, bike, transit, micro transit friendliness, doesn’t imply “CRAMMED” or stuffed or “Density”. This is not smart growth but marketable…. new urbanism.
Density is a loveable, laughable pet subject….
Environmentalists whine about, who argue that densely populated cities are the solution to lower the energy requirements for transportation and living. On the other hand, the solar envelope shows that above a certain threshold, density can also raise energy requirements, in particular heating, cooling and daylighting.
Sprawl advocates use density as an argument for more segregated housing types which many have used for decades to keep out social riff raff. Suburbs are prone to same urban decay as city big brothers…don’t believe me…. See Memphis and Detroit.
A wonderful comparison between a “Texas donut” (also called a Dallas donut) where a single building/network of development wrapped around a parking deck
https://images.squarespace-cdn.com/content/v1/53765fd8e4b0c4a5e910ed43/1444320818628-LQ4QTHC1WAJ3XSOIY2E5/Cover+Image_B.jpg
and “Charleston’s style” traditional architecture. It comes from design consultants Bevan and Liberatos.
https://images.squarespace-cdn.com/content/v1/53765fd8e4b0c4a5e910ed43/1444320818835-14MRUNSIP02CV8Z82YAE/Cover+Image_A.jpg
The Charleston system has 13 gardens, vs. none in the donut. There are 68 porches in the Charleston block, zero in the donut.
The donut does have more parking spaces, although the Charleston block has plenty for urban living.
Small Buildings are Highly Adaptable….Small buildings are more adaptable for reuse as requirements change over time. Flexible building stock is essential for encouraging small businesses, local start-ups. Big buildings have almost no adaptive re-use…once built is destined to a 30-40 year shelf life…..
Why transition so different. Texas donut was designed to house 200 cars. Charleston design was designed to house people.
Parking is free, but housing is expensive….and we wonder why we have a problem.
The advantage of the Charleston plan is modularity.
Charleston neighborhood can grow to host an eclectic mix of owners and residents. Some might occupy their own homes; some might rent them out. Some might maintain their property better than others. Some might make additions or modifications. Some will plant gardens; some will have lawns; some paved patios. All this eclecticism will result in a bunch of natural experiments in what makesca place great. Incremental, traditional development, and it’s worth contemplating the advantages of the traditional approach.
The big Texas Donut apartment building has one owner, although it has many tenants. This may work fine when it’s shiny and new, little to no maintenance is necessary, and rents are profitably high. But what happens over time in a neighborhood that has a bunch of these? What if the property management is shoddy, or maintenance is deferred, or the owner goes bankrupt, or the neighborhood takes a downturn? The scale of the resulting blight ruin a neighborhood for a generation.
on the flip side, the sale of a large building like this to a new owner who jacks up the rent, or evicts the tenants and redevelops the property, creates an instant displacement crisis. In contrast, the whole block in Charleston, with its dispersed ownership, is never going to change hands all at one time—there is greater stability in that respect.