
Earlier this month, the Federal Transit Administration published its annual report on funding recommendations for transit capital improvement grants. Each year, I review the accompanying list of projects being planned or under construction to see how much construction costs have grown since the previous year. This year, however, transit agencies seem to have learned a lesson from the pandemic and have curtailed their wild spending on pointless projects.
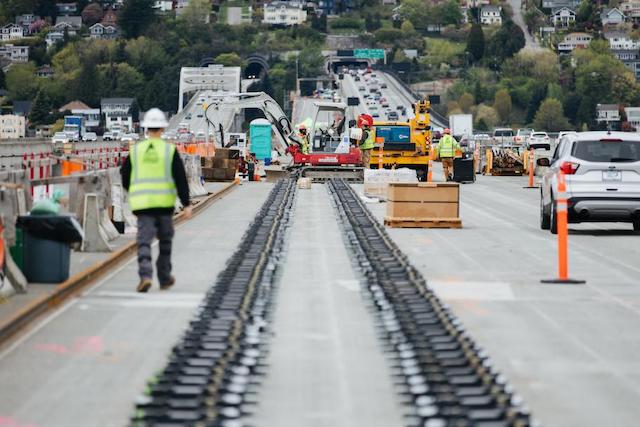
Sound Transit is building light rail on what was once freeway lanes across Lake Washington. Photo by Sound Transit.
Just kidding. In fact, they are spending more than ever. In the 1990s, light-rail lines that cost $50 million a mile ($100 million in today’s dollars) were considered extravagantly expensive. A decade ago, the average light-rail line cost about $125 million a mile ($160 million in today’s dollars). Last year, average light-rail construction costs had risen to $278 million a mile (about $310 million today).
This year, the average light-rail cost has grown to $384 million a mile. Average commuter-rail costs have grown from $232 million a mile last year to $447 million a mile. Average heavy-rail costs have exploded from $974 million a mile to $1.4 billion a mile. Bus-rapid transit costs have grown from under $16 million a mile to nearly $22 million a mile.
2024 Transit Capital Improvement Projects
| UZA | Route | Mode | Cost | Miles | Cost/mile |
|---|---|---|---|---|---|
| Flagstaff | Spine | BR | 33 | 13.0 | 2.5 |
| Monterey | SURF! | BR | 66 | 19.5 | 3.4 |
| Seattle | Rapid Ride K | BR | 90 | 15.7 | 5.7 |
| Minneapolis | Metro F Line | BR | 98 | 13.0 | 7.5 |
| Milwaukee | N-S | BR | 148 | 18.0 | 8.2 |
| Seattle | Rapid Ride I | BR | 141 | 17.0 | 8.3 |
| Indianapolis | Blue Line | BR | 220 | 24.0 | 9.2 |
| Memphis | Innovation Corridor | BR | 73 | 8.0 | 9.2 |
| Madison | E-W | BR | 160 | 15.5 | 10.3 |
| Tacoma | Pacific Avenue | BR | 170 | 14.3 | 11.9 |
| Cleveland | Metrohealth | BR | 50 | 4.0 | 12.5 |
| Washington | Veirs Mill Road | BR | 102 | 7.6 | 13.4 |
| Salt Lake | Midvalley | BR | 103 | 7.0 | 14.8 |
| Raleigh | Wake Western | BR | 180 | 12.0 | 15.0 |
| Chapel Hill | N-S | BR | 141 | 8.2 | 17.2 |
| Columbus | East Main | BR | 225 | 13.0 | 17.3 |
| Miami | E-W Corridor | BR | 281 | 13.5 | 20.8 |
| Columbus | West Broad Street | BR | 185 | 8.5 | 21.8 |
| Atlanta | Clayton Southlake | BR | 338 | 15.5 | 21.8 |
| Seattle | Rapid Ride J | BR | 121 | 5.2 | 23.2 |
| Las Vegas | Maryland Parkway | BR | 305 | 12.5 | 24.4 |
| Alexandria | West End | BR | 130 | 5.3 | 24.4 |
| Fort Collins | West Elizabeth | BR | 74 | 3.0 | 24.8 |
| San Antonio | N-S | BR | 320 | 11.7 | 27.4 |
| Charleston | Lowcountry | BR | 625 | 21.3 | 29.3 |
| Minneapolis | Purple Line | BR | 445 | 15.0 | 29.7 |
| Denver | East Colfax | BR | 255 | 8.5 | 30.0 |
| Raleigh | Wake Southern | BR | 174 | 5.1 | 33.9 |
| San Antonio | Advanced RT | BR | 293 | 7.3 | 40.1 |
| NYC | Woodhaven | BR | 259 | 6.1 | 42.4 |
| Atlanta | Campleton | BR | 275 | 6.0 | 45.8 |
| Rochester MN | Link | BR | 143 | 2.9 | 49.4 |
| Houston | University Corridor | BR | 1,566 | 25.3 | 61.9 |
| Fairfax County | Richmond Hwy | BR | 730 | 7.4 | 98.6 |
| Fort Lauderdale | Broward CR | CR | 297 | 11.5 | 25.8 |
| Miami | NE Corridor | CR | 414 | 15.0 | 27.6 |
| Orlando | Airport Connector | CR | 200 | 5.5 | 36.4 |
| NYC | Hudson Tunnel | CR | 12,685 | 6.5 | 1,951.6 |
| San Francisco | Transbay Extension | CR | 4,700 | 2.4 | 1,958.3 |
| Salt Lake | Frontrunner Double Track | CR Cap | 966 | 82.0 | 11.8 |
| Northern VA | Core Capacity | CR Cap | 2,415 | 6.0 | 402.5 |
| Chicago | Red Line Ext | HR | 3,730 | 5.6 | 666.1 |
| Los Angeles | Purple Line Ext 2 | HR | 2,499 | 2.6 | 965.0 |
| Los Angeles | Purple Line Ext 3 | HR | 3,599 | 2.6 | 1,406.0 |
| San Jose | BART II | HR | 9,318 | 6.0 | 1,552.9 |
| NYC | Second Ave | HR | 6,949 | 1.8 | 3,948.1 |
| NYC | Carnarsie Line | HR Cap | 373 | 6.0 | 62.2 |
| Minneapolis | Blue Line Ext | LR | 1,536 | 13.5 | 113.8 |
| Minneapolis | SW | LR | 2,000 | 14.5 | 137.9 |
| Austin | Blue Line | LR | 2,000 | 8.2 | 243.9 |
| Austin | Orange Line | LR | 3,800 | 12.0 | 316.7 |
| Los Angeles | West Santa Ana | LR | 5,000 | 14.8 | 337.8 |
| Seattle | Lynnwood | LR | 3,260 | 8.5 | 383.6 |
| Los Angeles | East San Fernando Valley | LR | 3,635 | 6.7 | 542.5 |
| Philadelphia | King of Prussia | LR | 2,082 | 3.8 | 547.9 |
| Seattle | West Seattle-Ballard | LR | 3,200 | 4.7 | 680.9 |
| Inglewood | Connector | LR | 1,150 | 1.6 | 718.8 |
| Seattle | West Seattle-Ballard | LR | 9,000 | 7.1 | 1,267.6 |
| Boston | Green Line Restoration | LR Cap | 2,100 | 23.0 | 91.3 |
| Tampa | Extension | SR | 235 | 4.0 | 58.6 |
| Sacramento | DT Riverfront | SR | 117 | 1.5 | 78.0 |
| Los Angeles | Historic Streetcar | SR | 296 | 3.4 | 87.2 |
| Seattle | City Center | SR | 286 | 1.3 | 219.6 |
| Livermore | Valley Link | YR | 1,800 | 26.0 | 69.2 |
These projects are under construction or under consideration for federal funding. CR Cap, HR Cap, and LR Cap are capacity improvements or rehabilitations of existing lines and aren’t counted in construction cost averages calculated in the article. For a few projects, cost estimates were given as a range, so this table shows the mid-point of the range.
The increase in commuter-rail costs is partly due to New York-New Jersey getting funding to rebuild the Hudson River Tunnels, a $12.7 billion project. But the cost of San Francisco’s Transbay commuter-rail extension is also pretty high. In fact, while the FTA says it is expected to cost $1.96 billion a mile, the latest cost estimate is $2.79 billion a mile.
Too often, it seems like regions are competing with one another to build the most expensive projects. Los Angeles, for example, has two light-rail projects on the list, one of which will cost a mere $338 million a mile and the other $543 million a mile. It also has two heavy-rail projects that are really two different extensions of the same line; together, they will cost $1.18 billion a mile.
Not to be outdone, Seattle has three light-rail projects in the works, the least expensive of which is $384 million a mile. The other two are $681 million a mile and $1.27 billion a mile. Philadelphia has a light-rail project costing $548 million a mile.
The least-expensive light-rail project on the current list is in the Twin Cities and was expected to cost $114 million a mile — except that Metro Transit was hoping to use a freight railroad right-of-way, but the railroad has refused to let it do so, so the actual cost will probably be much more. Another Twin Cities light-rail project is under construction and the FTA reports that it will cost $138 million a mile — except that it is behind the times as the current projection is $186 million a mile. No other light-rail project on the list is expected to cost less than $240 million a mile, and some of those will probably cost much more than the FTA says.
Streetcars were supposed to be the low-cost version of light rail, but their average cost has crept up to more than $90 million a mile. But that’s deceptive because most transit agencies measure streetcar miles by total miles while other rail lines are measured by route miles. When measured as route miles, the average cost is $145 million a mile.
I suspect that transit agencies think of bus-rapid transit as the poor agencies’ version of light rail. The average cost of $22 million per mile seems almost reasonable when we forget that the nation’s first modern light-rail line opened in San Diego in 1981 at a cost of about $8 million a mile.
More than half the projects in this year’s list are bus-rapid transit and they range in cost from $2.5 million to $99 million a mile. If they all cost $2.5 million a mile it would be hard to argue with them, but many are more than $40 million a mile.
Fairfax County Virginia, the one planning to spend $99 million a mile, plans to build new lanes in the median of an existing highway. This is overkill, especially considering the huge reduction in transit ridership in the Washington DC area since the pandemic.
In most other cases, BRT will take lanes away from other motor vehicles and reset traffic signals to give buses priority over everyone else. The result will be more traffic congestion and, in most cases, not many new transit riders.
The real problem is that Congress has created a pot of money now worth about $2 billion a year and invited transit agencies to scoop as much out of it as they can. There are no controls over costs and the FTA appears as willing to fund a light-rail line that costs more than $1.2 billion a mile as one costing a tenth of that amount. Taxpayers lose, transit riders lose because spending a fraction of this money on bus improvements would lead to much better service, and auto drivers lose because many of the bus, light rail, and streetcar projects will increase traffic congestion.


FTA has been complicit in every transit failure since FTA was created. Is it incompetence or corruption?
Henry Porter,
I think the word is careless, as they could care less about cost overruns, ridership short falls, impacts on traffic or low-income people or anything else. All they care about is keeping the money flowing.
A problem with Southwest Rail isnt’ just that they planned assuming they’d get the right of way they wanted.
When they did it, they made a very weird choice, they chose to dig a tunnel for the LRT trains rather than a bridge for the trail and/or rerouting. No one needs a civil engineering degree to understand the trail option will be far less expensive.
The worst thing about Metro Transit’s Southwest light rail is doesn’t connect anything to downtown. It just runs through backyards, back sides of a few warehouses, the backside of a Walmart and ends at an existing park and ride.