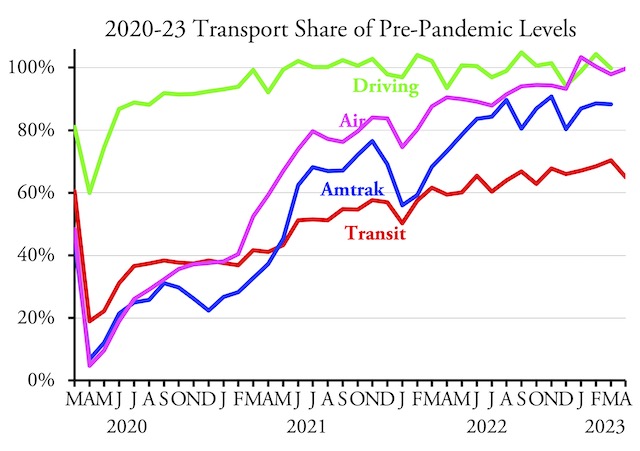
America’s transit systems carried 65.0 percent as many riders in April 2023 as the same month in 2019, according to data released by the Federal Transit Administration yesterday. This is down from 70 percent in March.
TSA data indicate that the airlines carried 99.7 percent as many passengers in April 2023 as April 2019. Data for Amtrak and highway travel have not yet been released but I’ll post an update here when they are.
The reason for the variation is simple: March had two more business days in 2023 than in 2019, while April had two fewer. February has the same number of business days each year, so transit’s February performance of 68.5 percent is probably a realistic estimate for the future. The transit industry’s record for the year to date is 67.9 percent of the first four months in 2019, which is pretty close to 68.5 percent.
Transit is doing much better in a few urban areas. Los Angeles as at 91%; San Diego is 80%; Tampa 85%; Las Vegas 81%; Kansas City 89%; and Hartford and Bridgeport-Stamford are both hovering around 100%. Transit is not doing so well in Chicago (56%), Philadelphia (55%), Atlanta (40%); Detroit (49%); Phoenix (also 49%); San Francisco-Oakland (57%); Twin Cities (53%); Denver (56%); Baltimore (58%); and St. Louis (53%).
Transit’s recovery is thought to be closely related to downtown recoveries. But several downtowns are estimated to have more economic activity now than before the pandemic, yet their transit systems haven’t come close to full recovery. These include Columbus (109% downtown recovery but only 53% transit recovery), Salt Lake City (139% and 72%), El Paso (118% and 55%), Fresno (115% and 77%), and Bakersfield (118% and 55%). This suggests that even if downtowns do eventually recover, telecommuting plus people’s worries about crime and contagious diseases will still take a big bite out of transit.
These numbers are preliminary and some changes can be expected in future months. For example, the Greater Cleveland Regional Transit Authority seems to have failed to report any ridership numbers since February. When it finally does so, those numbers will be included in future reports. Cleveland accounts for only a third of a percent of nationwide transit ridership, so those numbers won’t add much to the national totals.
As usual, I’ve posted an enhanced spreadsheet with the FTA’s raw data in cells A1 through JE2253; annual totals in columns JF through KA; comparisons of April 2023 with April 2019 and 2022 plus year-to-date 2023 with 2019 in columns KB through KD; mode totals in rows 2255 through 2276; transit agency totals in rows 2283 through 3279; and urban area totals in rows 3281 through 3771. I hope you find this useful.


