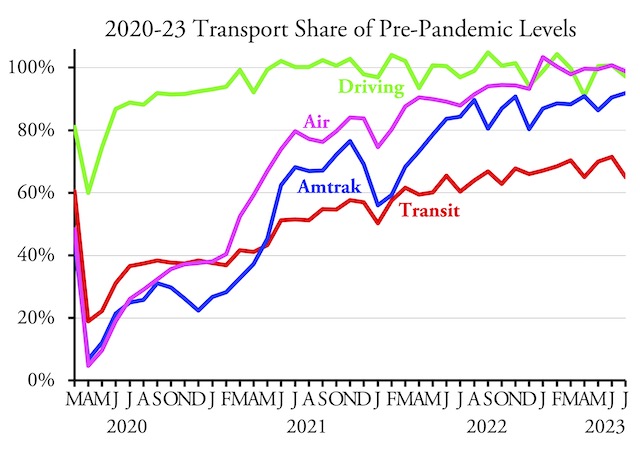
After reaching 70 percent of pre-pandemic numbers in June, transit ridership in July fell back to 65 percent of July 2019, according to data released last week by the Federal Transit Administration. Since July 2019 had 22 working days while July 2023 only had 20, this decline is not surprising.
Meanwhile, Americans drove 97.2 percent as many miles in July 2023 as in the same month of 2019, according to Federal Highway Administration data released last week as well. Amtrak’s monthly performance report indicates that the railroad carried 91.2 percent as many passenger-miles in July 2023 as July 2019, while the Transportation Security Administration says that 98.8 percent as many travelers passed through security in July as in 2019.
This is the first time since I began reporting post-pandemic travel that all four modes released data in the first week of the month. TSA’s daily passenger counts are always released a day or two after each day, but the others usually take from five to seven weeks to release each month’s data. I don’t know whether Amtrak, the FHwA, or FTA released their data first, as I wasn’t expecting the data to become available so soon so I didn’t check between Monday and Friday.
In any case, the results are predictable, with buses carrying more than the average and rail less. The exception was commuter buses which carried much less than average. The clear implication is that transit has lost many of its high-income riders, the ones more likely to ride trains and commuter buses. Similarly, transit is doing worse than average in urban areas where it catered to high-income riders, such as Atlanta, Phoenix, San Francisco, and Washington, while transit is doing better than average in urban areas where it served mainly low-income riders, such as Miami, Tampa, and Las Vegas.
I’ve previously noted that the Greater Cleveland Regional Transit Authority hasn’t been reporting ridership numbers. Transit agencies in San Jose and St. Louis also failed to report any numbers in July. So the final numbers may show transit carrying around 65.5, not 65.0, percent of 2019 levels in July.
As usual, I’ve posted an enhanced spreadsheet (19.0-MB) showing annual totals in columns JJ through KE, mode totals in rows 2271 through 2291, transit agency totals in rows 2300 through 3299, and urban area totals in rows 3301 through 3791.
If anyone actually downloads this or the original FTA data file, the FTA has made a change in how it designates urban areas. Previously it used a three-digit code, 1 to 602, designating each urban area by size in the last census, meaning New York was always 1 but smaller urban areas sometimes traded positions. However, when a transit agency went out of business, the FTA didn’t keep the codes updated with each new census, so some agencies were attributed to the wrong urban areas.
To fix this, the FTA is now using a standard, five-digit census code for each urban area that (we hope) won’t change from census to census. The FTA’s June monthly data file included both the three-digit and five-digit codes but July’s only includes the five-digit code, so I had to add the five-digit codes to the list of urban areas in rows 3301 through 3791 so Excel could look up the correct data for each urban area. This will make the results a little more accurate since I wasn’t always diligent about fixing the three-digit codes in the monthly updates.
I don’t think there are any earth-shaking results in the highway, Amtrak, or airline data, but if I find any I’ll report on them later this week.


