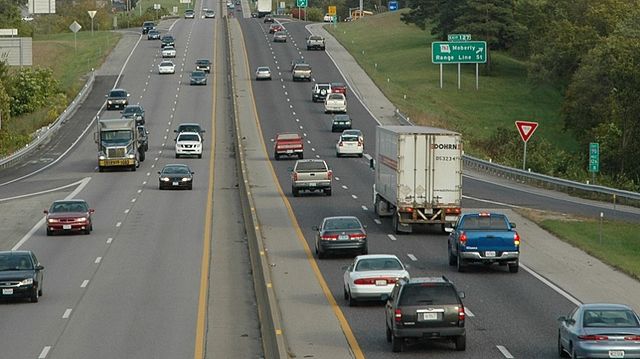
The average motor vehicle on the road carried 1.52 people in 2022, down from 1.67 in 2019, according to the 2022 National Household Travel Survey. The results of this survey, which is repeated about every five years, were recently released by the Federal Highway Administration.
The survey has lots of interesting data, including information on motor vehicles, vehicle trips, and passenger-miles of travel. Much of it, however, is not quite ready for prime time. For example, the data release indicates that households who earn less than $10,000 a year nevertheless own 6.3 million vehicles — but it doesn’t say how many households that represents or how many don’t own vehicles.
The survey is based on a sample of something more than 31,000 people, which should be sufficient for general questions such as “how many vehicles does your household own?” But it is questionable for finer questions such as “how many passenger-miles did you travel by air and how many by mass transit?”
The survey reports, for example, that Americans traveled 385 billion passenger-miles by air in 2022. But the Bureau of Transportation Statistics says that U.S. airlines carried 708.8 billion passenger-miles in that year, which is based on reports from the airlines themselves. A few of those passenger-miles might have been foreigners, but not 324 billion.
The survey also reports that Americans rode transit buses 14.3 billion passenger-miles. But the transit agencies themselves say it was only 11.1 billion. So you will pardon me when I say I am suspicious when the survey says Americans traveled 2.4 trillion passenger-miles by car or light truck, since the Bureau of Transportation Statistics reports closer to 3.5 trillion, which is based on miles of driving calculated by another part of the Federal Highway Administration. The BTS number is based on 1.67 passengers per vehicle, but even adjusting for that the survey number still falls short of the BTS by almost 25 percent.
In the past, I’ve trusted the 1.67 occupancy number because it was reported by both the 2012 and 2017 household transportation surveys (see table 16 on page 58). The first survey, in 1977, estimated an average occupancy of 1.90, but family sizes were larger then, so I would expect occupancies to be higher.
I can see where occupancies in 2022 might be a little lower due to the pandemic. But most travel is with family members, not strangers, and family sizes haven’t appreciably dropped between 2017 and 2022, so a drop in auto occupancy from 1.67 to 1.52 is pretty unexpected. I’ll be interested in seeing more complete documentation when it becomes available.
In any case, I haven’t looked at all of the data in detail, but if I find anything that is truly fascinating, I’ll report it here.


I’m willing to bet a dollar that in the next few years, some brilliant expert in computer science will figure out how to measure (estimate?) the number of people in a passing car based on data from one or more roadside cameras. A human could do it, but we are expensive and need bathroom and coffee breaks.
Wild speculation here. But Google has massive data on exactly how we drive. Is it detailed enough to figure out acceleration profiles? Could it theoretically tell the difference between a car with one passenger and one without? An extra ~150 pounds isn’t negligible.
Ha! The technology to count people exists … or count people carrying cell phones.
WIFI and Bluetooth device can be used to create rich data sets that lead to valuable business insights. Applications include WiFi and Bluetooth people counting, spatial analytics, smartphone detection, vehicle counting, dwell times, travel routes, commute times and vehicle occupancy rates.
People counting using WIFI and Bluetooth