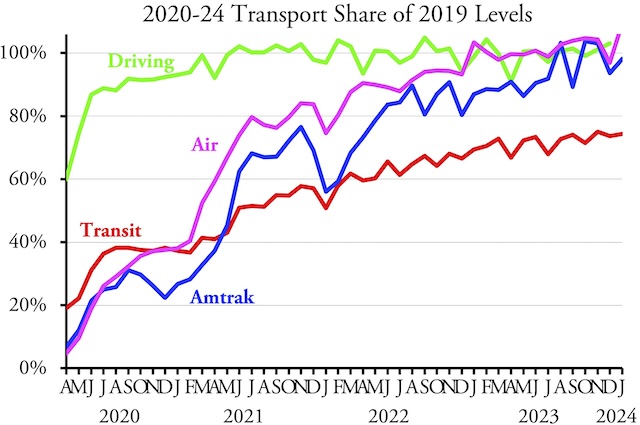
Driving and flying have been hovering around 100 percent of pre-pandemic levels for the last year and Amtrak has been around 100 percent for the last six months, but transit is still stuck at just below 75 percent, according to monthly data released by the Federal Transit Administration yesterday. Transit first reached 73 percent last March and 74 percent in September, and even exceeded 75 percent in November (a month that had more business days in 2023 than 2019), but it doesn’t look like it will get significantly above 75 percent for a long time.
When measured as a percent of pre-pandemic travel, transit continues to lag well behind all other modes of travel. Highway data for January 2024 should be available soon. For more on Amtrak and air travel, see yesterday’s post.
The results vary by urban area, of course. Above-average areas include New York (80.5%), Miami (90.5%), Washington (80.6%), San Diego (80.6%), Tampa-St. Petersburg (83.4%), Las Vegas (83.6%), Cincinnati (96.7%), Austin (82.8%), and Richmond (113.1%). Remaining well below average are Chicago (62.6%), Atlanta (53.0%), Boston (62.0%), Detroit (54.7%), Phoenix (50.4%), San Francisco-Oakland (59.0%), St. Louis (58.6%), Pittsburgh (54.5%), and Jacksonville (56.9%).
Any transit agency planning major improvements needs to reduce its forecasts to account for post-pandemic changes in travel patterns. That means, at the very least, that if an agency has recently been carrying 75 percent of pre-pandemic numbers, all ridership forecasts should be reduced by 25 percent. Much better would be if agencies recognize that the urban areas they serve are no longer monocentric and completely redesign their transit networks to serve multiple economic centers.
Unfortunately, neither of those are likely to happen anytime soon. With billions of dollars to give away, the Federal Transit Administration doesn’t even seriously care what ridership forecasts say. And with transit agencies getting millions to billions of dollars regardless of actual ridership, they don’t seriously care if they serve more than a tiny fraction of the people in their regions or not.
The Antiplanner has posted an enhanced version of the Federal Transit Administration’s monthly database. The FTA’s raw data are in cells A1 through JO2288. Annual totals from 2002 through 2023 are in columns JP through KL. Column KM compares January 2024 with January 2019. Column KN compares January 2024 with January 2023.
National and mode totals are in rows 2290 through 2309. To show New York’s importance, row 2314 shows the percentage share of ridership that takes place in the New York urban area. Transit agency totals are in rows 2330 through 3319. Urban area totals are in rows 3321 through 3811. These enhancements are on the ridership (UPT for unlinked passenger trips) and service (VRM for vehicle-revenue-miles) worksheets. I hope you find this spreadsheet useful.


I said it before transits role in urban economics is biggest reason for transits decline. When Steve Jobs drafted his proposed plans for his new Campus Headquarters, the “Ring”
https://upload.wikimedia.org/wikipedia/commons/thumb/5/5a/Aerial_view_of_Apple_Park_dllu.jpg/800px-Aerial_view_of_Apple_Park_dllu.jpg
in, Cupertino debated and had demanded parking, he wanted an orchard. So he moved it out of taxable range of city limits. Of course when he died Apple
built parking garages. Cuz after all; with No transit, bus, or biking how else accommodate 14,000 daily employees.
Apple built this just to escape Cupertino tax regime.
One image that shows how much more freedom Americans enjoy compared to other countries:
https://pbs.twimg.com/media/GIQl5W-X0AANUOG?format=jpg&name=medium
Pedestrian fatalities in Europe rose too but are Lower than the US. But statistics are bucked; problem with Per capita statistics.
Europe has twice US population. Where as Americans drove 5 Trillion miles, EU27, drives little over half that much……
If we measure pedestrian fatalities with respect to Per Billion passenger miles USA and EU are similar.
And if no one drove a car, there would be no automotive deaths. Progress!
That’s right, Lazy Reader, just like if we look at gun deaths per bullet fired (rather than the distorted statistic of deaths per capita), the US is just as safe as other countries and not nearly as dangerous as anti-gun fanatics would have you believe.
Gun violence in America is a demographic thing.
Subtract blacks it goes down almost 60%, subtract Latinos another 30%.
https://americanprogress.org/wp-content/uploads/sites/2/2018/05/YouthUnderFire-fig3-693.png
What do Iceland, Canada, New Hampshire, Vermont have in common…..
Crime is not much of an issue, in ethnically homogenized, High IQ socities
Crime is not much of an issue in the US either, if you look at deaths per bullet. As I explained above, deaths per bullet in the US are very similar to other countries, just like deaths per automobile miles traveled.