Less than half of New York City residents feel safe riding the subway today, down from 82 percent before the pandemic. Subway crime is so bad that New York’s governor called out the national guard to patrol subway stations. Crime is up on San Francisco BART trains despite the agency putting more police on trains. A few days ago, a mentally ill person stabbed someone to death on a Portland light-rail train.
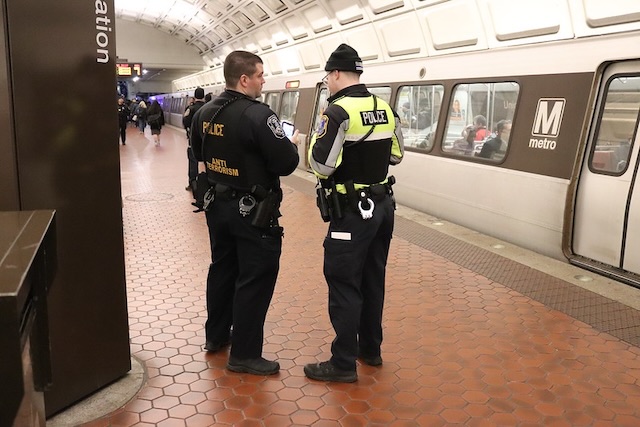
Will putting more police in subway stations solve the crime problem? Probably not if BART’s experience is any guide. Photo by Elvert Barnes.
Some people say transit crime is dropping so it’s safe to ride transit. Others say it is getting worse. Who’s right? We can get some answers from the Federal Transit Administration’s Major Safety Events Database, which was recently updated with data through the end of 2023.
The database lists more than 88,000 safety and security events since 2014. Safety events include things like collisions between transit vehicles and other vehicles. Security events include assaults and murders. The database counts suicides as security events, but I think they reflect safety problems and have adjusted the data to account for this. Suicides appear to be way down since the pandemic, possibly because transit agencies have stopped blaming accidental fatalities on suicides.
The database does not include commuter rail as apparently that mode is monitored by the Federal Railroad Administration. Crime rates on commuter buses are much lower than other buses and it is likely that crime rates on commuter rail are similarly low.
Some other security events are also not crimes. If someone accidentally leaves a backpack on bus or train, transit police may decide to evacuate the vehicle in case the backpack contains a bomb. The event gets written up even if the backpack turns out to be innocent. Rather than go through all 88,646 events recorded in the database, I’m going to assume that such innocent events are distributed equally among all agencies and modes. If true, then the crime rates reported below will be a little higher than the truth, but the relative rates between cities and mode will be about the same.
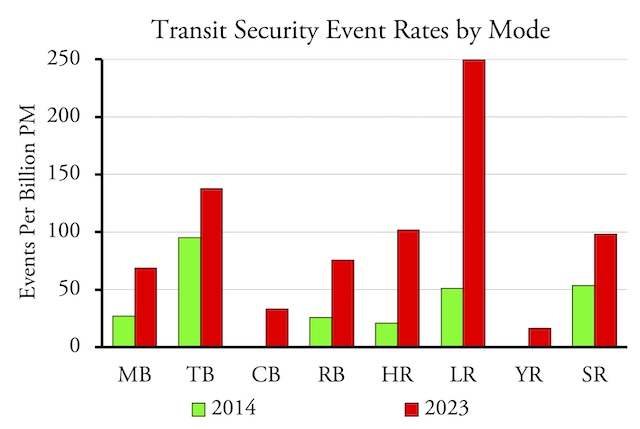
Modes of transit that collect fares using the honor system tend to have the greatest security risks for passengers. MB=conventional bus; TB, CB, & RB are trolley, commuter, and rapid bus; YR is hybrid rail meaning Diesel-powered light rail; SR=streetcars.
In recent years, heavy rail has seen far more security problems than any other mode of transit. But heavy rail also carries far more riders than any other mode except conventional buses. To assess the risk people take when riding various transit systems, I’ve calculated the number of safety or security events per billion passenger-miles. Passenger-miles from 2014 through 2022 are in the National Transit Database historic time series, table TS2.1. For 2023, I estimated passenger-miles by multiplying the average trip length in 2022 (passenger-miles divided by trips) by the number of trips in 2023.
I last reviewed transit security in 2022 using data through 2021. The most recent data show that transit crimes, per billion passenger-miles, have slightly dropped from 2021, but are still worse than from before the pandemic. However, crime rates were already growing before the pandemic began, meaning that crime rates today are much worse than in 2014.
Not counting suicides, bus and rail riders suffered an average of 274 crimes and 0.3 murders per billion passenger-miles in 2014. This rose to 431 crimes and 1.6 murders per billion in 2019, then leapt to 1,046 crimes and 4.9 murders in 2021, declining to 781 crimes and 2.9 murders in 2023. The 2023 numbers make transit look safe compared with 2021, but transit riders were still almost three times more likely to be crime victims and ten times more likely to be killed in 2023 than in 2014.
The highest crime rates are on light rail, streetcars, and trolley buses. Light rail and streetcars both collect fares using the honor system, and the broken windows hypothesis suggests that making it easy to evade fares invites more crime. Trolley buses are only found in a few cities and crime rates on this mode are skewed by high rates in San Francisco, which also collects fares using the honor system on its trolley buses. It is worth noting that many cities are addressing transit crime on heavy rail by installing better fare gates and St. Louis is planning to install such gates for its light-rail system.
Not counting suicides, light-rail crimes grew from 51 per billion passenger-miles in 2014 to 127 in 2019, then more than doubled to 282 in 2021 and then fell to 250 in 2023. In most years, light-rail riders suffered about two-and-one-half times as many crimes per billion passenger-miles than heavy-rail riders. Streetcar numbers were about the same or a little lower while trolley bus numbers were a little higher before the pandemic but have been lower since the pandemic.
Again not counting suicides, light-rail fatalities related to security issues rose from 1.2 per billion passenger-miles in 2014 to 4.8 in 2019, quadrupling to 22.7 in 2021, then falling to 11.3 in 2023. These rates were generally two to four times as high as for heavy rail. The good news is it appears no one was murdered on a streetcar or trolley bus in those years.
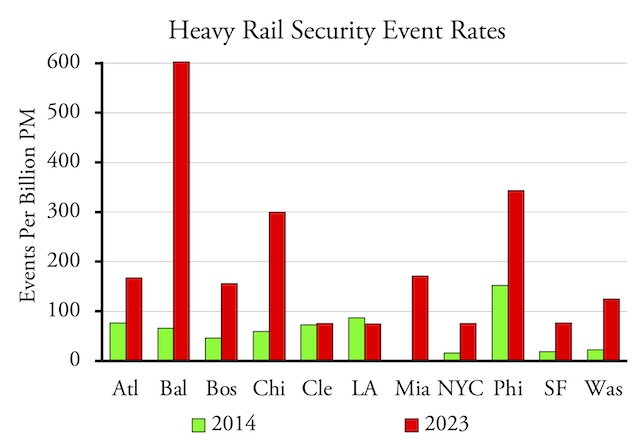
From 2014 to 2023, crime rates greatly increased for most heavy-rail systems. Not included are New York and Philadelphia secondary systems (port authorities and Staten Island) as some of them hadn’t reported 2023 data yet to the FTA.
Among heavy-rail systems, Philadelphia’s suffered the highest crime rates in 2014, with more than 150 crimes per billion passenger-miles. This was ten times the rate on the New York City subways or BART system. By 2021, rates had increased almost everywhere but Baltimore had eclipsed Philadelphia as having the most dangerous heavy-rail system with more than 1,000 crimes per billion passenger-miles. This declined to about 600 in 2023. Crime rates on the New York subway and the BART system had grown to more than 75 per billion passenger-miles, which was much less than Baltimore but still quintuple the 2014 rate.
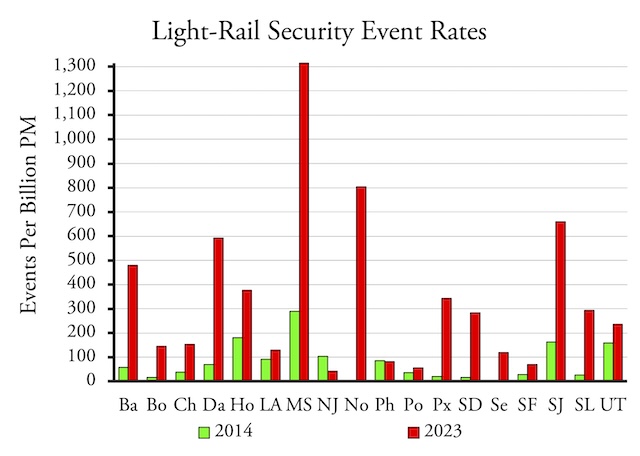
From 2014 to 2023, crime rates greatly increased for most light-rail systems as well. To fit them in the chart, I used two-letter codes for each city. MS=Minneapolis-St. Paul, NJ=New Jersey Transit; Ph=Philadelpha; Px=Phoenix; UT=Utah Transit. Some light-rail cities aren’t shown as they apparently haven’t yet reported 2023 data to the FTA.
Among light-rail systems, the one in Minneapolis-St. Paul is still by far the most dangerous. Crimes there grew from just under 300 (which would be high even in 2023) per billion passenger-miles in 2014 to well over 1,600 in 2020, then fell a bit to 1,300 in 2023. As of 2023, Norfolk’s light rail is second with 800 crimes per billion and San Jose’s is third with 660.
To be fair, Norfolk’s light rail is the least-used line in the country so it only took two security events for its rate to reach 800 per billion passenger-miles. In general, looking at trends makes more sense for large agencies than small ones where one or two events can dramatically alter overall rates.
Although safety issues have not gotten as much media attention as security issues, overall safety fatalities are about twice as great as security fatalities. Moreover, for some modes safety fatality rates have grown more than security fatality rates.
Light rail has been involved with about the same number of fatalities per year, with 29 in 2014 and 28 in 2023. But with the post-pandemic decline in ridership hitting light rail especially hard, the fatality rates grew by 50 percent between 2014 and 2023. Heavy rail is worse, with fatalities rising from 35 in 2014 to 97 in 2023 with the result that fatality rates more than octupled. Other modes have not seen such a large increase in fatalities, but for rail and bus transit as a whole, safety fatality rates more than doubled between 2014 and 2023.
This database is massive and difficult to use so I’m not going to bother posting an “enhanced spreadsheet” on line. Anyone who is interested in data for specific urban areas, agencies, or modes should contact me and I’ll try to provide the information.


With cars you can get road rage, theft and creeps stalking and potential robbing/kidnapping you at the parking lot.
Show the whole story. Car thefts have surged in San Francisco and Portland.
Another reason to support personal rapid transit.
Personal Rapid Transit = car
The scooter folks are a nuisance to vehicles, actual pedestrians, and wheelchair-bound individuals. They are also a health hazard to the riders and a generator of numerous emergency room incidents.
Cars take you where you need to go, when you need to go, the route you want to go, with a climate under your control, and with only the people you choose.
The carbitself is not the intended target. Valuables inside. San Francisco is so plagued , residents leave the cars unlocked and open at night to deter breaking in.
Yet O’Toole still gives you one-sided information.
They can easily offer higher capacities than freeways do.
They take up far less space than cars.
You and local governments have far fewer responsibilities to take care of them.
Best of all, they do not need massive amounts of parking.
Sounds like a good reason to stay away from San Francisco and Portland, but not necessarily a good reason not to drive. I’ve had many posts covering auto and highway safety, so you can’t accurately claim that the Antiplanner is one-sided.
okay… thanks….
The great part about diving my own car is the homeless are never in my car and I know the car will be clean.
Portland has many problems, all created by the democrats that run the city, county and state and do not prosecute many crimes.
They can still break in. Harass you while you walk towards it.
Why is the AP giving light rail fatalities in absolute numbers rather than per billion miles?
I mean if we are going with absolute numbers, there were 28 light rail deaths in 2023 and 40,990 car deaths in the same year, so I would conclude that traveling by light rail is 1,500x more safe than traveling by car.
Why would you go with absolute numbers? Far more people are killed by deer each year than by crocodiles, but would you go swimming with crocodiles?
Far more people are killed by deer; because often we run into them in automobiles.
If we use Antiplanner’ logic and thought math
we accumulate total passenger miles utilized and divide by total number of fatalities, assaults, rapes.
Ultimate question is IS LIGHTRAIL/Transit safe?
Compared to what.
In regards to crime; There are 35,000 carjackings, 719 thousand auto thefts, either the vehicle itself or parts of it.
USA
American’s drove 5 TRILLION miles for accumulated 40,990 casualties or 121 Million miles per casualty.
Transit carried 54 Billion passenger miles, and had 339 deaths in 2022. 159 Million miles per death.
Transit really is statistically safer.
Is it safe to live where you have to drive everywhere?
https://www.sciencedirect.com/science/article/abs/pii/S221414052400029X?via%3Dihub
“Residents of peri-urban areas were at higher cardiometabolic risk than those of inner urban areas, partly due to the former’s car-dependent lifestyles. Public health and transport initiatives/policies encouraging walking for transport and discouraging car use in peri-urban suburbs may help to reduce cardiometabolic risk.”
all this proves is that covid made transit more dangerous; probably because covid caused a spike in homelessness and homeless people arent necessarily in the best state of mind or financial situation, meaning outbursts and breakdowns become much more common along with robbery. And for safety fatalities, its likely due to the sudden cut of fares causing funding to nosedive in transit systems, which means the ones that are already hardly funded have a sudden backlog of maintenance issues and have to choose between completely shutting down transit (which further hurts fares) or sending out faulty vehicles and avoiding inspections. Automobiles wouldnt face security issues since homeless people generally cannot afford a car but can afford bus fares, and wouldnt face the safety issues since all that the automobile itself needs in constant funding is gas and basic maintenance, not a paycheck for drivers, maintenance crews, or constant maintenance due to constant usage. But regardless of this theory, this fails to compare private automobile and transit incidents