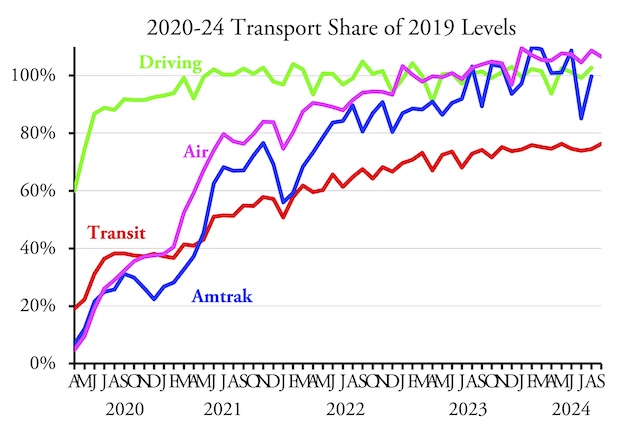
Transit agencies carried 76.3 percent as many riders in September of 2024 as they did in the same month in 2019, according to data released yesterday by the Federal Transit Administration. This is transit’s best performance, when measured as a share of pre-pandemic numbers, since the pandemic began.
Highway and Amtrak results for September will be posted here when it becomes available.
Highway travel had fully recovered from the pandemic by around July 2021. Air travel, which the Transportation Security Administration says carried 108.7 percent as many travelers as in September 2019, had recovered by January 2023 and Amtrak by October 2023. In October 2023, transit ridership still hadn’t reached 75 percent of pre-pandemic numbers, but that is probably the best it was going to do. Some of the growth in transit since then is due to some people returning to downtown offices, but much of that growth is probably more attributable to regular growth, not to recovery from the pandemic.
Commuter buses have performed the worst among major types of transit, still carrying less than half as many riders as in 2019. Commuter rail was just under 70 percent and heavy rail slightly more than 70 percent. Light rail was above average at 78 percent while regular buses were at 82 percent and bus rapid transit was 103 percent, probably because new lines have opened in the last four years.
Transit ridership in 2024 to date was 75.5 percent of 2019. Since September is the last month of the fiscal year for many transit agencies, I calculated the most recent year with October 2018-September 2019, but at 75.2 percent it was only slightly different from the year to date.
Despite transit’s rotten performance, the American Public Transportation Association (APTA) says that voters approved 19 out of 26 ballot measures increasing taxes by billions of dollars to support transit. APTA has done such good job at propaganda that many people still don’t realize that transit is more about pork barrel and political patronage than it is about moving people.
As usual, I’ve posted an enhanced spreadsheet presenting the raw FTA data in cells A1 through JW2301, with annual totals for 2002 through 2024 (to date) in columns JX through KT, mode totals in rows 2310 through 2331, transit agency totals in rows 2340 through 3339, and urban area totals in rows 3341 through 3831. Columns KV through KW compare September 2024 with September 2019, the years to date, and the last 12 months. All of these “enhancements” are included on the “UPT” (trips) and “VRM” (revenue miles of service) worksheets.


So long run..
https://nyc.streetsblog.org/2024/11/07/no-urgency-with-the-clock-ticking-hochul-twiddles-thumbs-on-congestion-pricing
The NYC Subway has 50 thousand employees, the MTA as a whole employs 70,000. Tokyo ( whose subway has similar track miles & ridership) has just 10,000. All-in cost of MTA employees = $130k per year. Not treating public transit as an employment agency would save $5.2 Billion per year. Fares to ride the subway could be nothing and we’d still have $2 Billion per year for improvements.