
“What is the optimal relationship between land use and transit,” asks Patrick Condon, “and what transit mode would best support this optimum state?” He concludes that cities should invest more in “trams” (streetcars) rather than in long-distance, higher-speed rail systems.
Flickr photo by NeiTech.
Condon is a professor of landscape architecture at the University of British Columbia, where he is also involved in Sustainability by Design, which is trying to create a sustainable “vision” for the Vancouver region.
Condon’s answers to the above questions differ greatly from from the Antiplanner’s. This is partly because Condon bases many of his calculations on hypothetical numbers rather than actual data, and partly because his definition of “optimal” seems to transmogrify from paragraph to paragraph so that, in the end, it means whatever he wants it to mean.
Condon’s previous research shows a regrettable tendency to rely on myth and hearsay rather than actual facts. For example, a 2004 paper on urban design says, “National City Lines, a ‘transit’ company owned outright by GM, Firestone, and Phillips Petroleum was formed to purchase urban streetcar lines, notably in Los Angeles, with the intention of dismantling them. In 1949 GM was convicted of anti trust violations for this practice.” There are so many errors in this statement it is hard to know where to begin.
Start with the incriminating quotation marks around “transit,” which imply that National City Lines was not really in the transit business but in the transit dismantling business. In fact, National City Lines operated more than 60 transit systems between 1920 and the 1960s. General Motors and the other so-called conspirators only owned the company between 1936 and 1949. During that time, only 23 of the transit lines owned by National City replaced their streetcars with buses (and many of them had started dismantling their streetcar lines long before National City bought them).
National City owned only one of the two major transit systems serving Los Angeles, and that system still operated streetcars when National sold it to Los Angeles County in 1958 — it was the county that finally dismantled the streetcars. General Motors was convicted (and fined $5,000) for trying to monopolize the market for buses, but none of the other conspirators were convicted of anything, especially not for trying to dismantle streetcar systems.
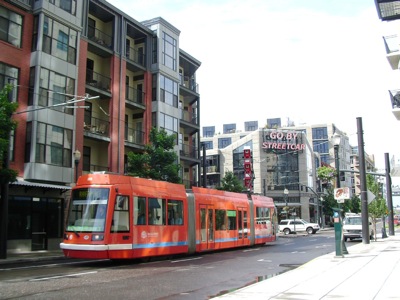
The General Motors streetcar conspiracy has been repeatedly debunked by academic researchers who are willing to look at the facts and not just the myth. Condon’s willingness to perpetuate myths and hearsay is further revealed in an 2008 paper called The Case for the Tram: Learning from Portland. The thing I learned from the paper is that Condon doesn’t know much about Portland. He claims that Portland decided to build a streetcar line “for compelling reasons: it was inexpensive and the areas to be served were not dense enough to justify the more expensive MAX light rail system.”
In fact, Portland’s first streetcar line connected the densest census tracts in the Portland area — Northwest Portland — with downtown. And, at $15 million per track mile plus a close to $2 million per vehicle, the streetcar was far more expensive than buses, which could have traveled through the area far more nimbly than streetcars. It is also worth noting that the streetcar was planned by the city, while the region’s transit agency thought so little of the streetcar route that it had never run bus service in that corridor.
Condon goes on to say that the decision to build the streetcar “was provoked by the electoral defeat” of light rail, which “left the city with only two options: forget transit or build it with their own money.” In fact, Portland decided to build the streetcar line in July, 1997, while the light-rail line was defeated at the polls in November, 1998. (And the transit agency is building the light-rail line — which did not go anywhere near the route of the streetcar — anyway.) Note also that Condon commits the common strategic misrepresentation of conflating “transit” with “rail transit.”
The Antiplanner’s suspicion that Condon relies on Portland official propaganda rather than actual facts is confirmed by his later claim that streetcars promoted urban redevelopment. As the Antiplanner has previously noted, Portland gave developers $665 million in subsidies to build along the streetcar line — something Condon fails to mention. But it is also interesting that Condon’s definition of “optimal” slips from “cost efficiency” in the first part of the Portland paper to “promoting economic development” in the last part.
In contrast, Condon’s more recent paper starts by considering dollar costs in the first paragraph, then shifts in the same paragraph to “sustainability” (which, in context, must have something to do with energy), but then in the second paragraph shifts again to greenhouse gas emissions, and finally in the third paragraph goes back to “long term cost efficiency.”
Condon’s fundamental problem is that you cannot “optimize” multiple variables. To find an optimum, you need to put everything in the same terms. This is what dollars are for: a medium of exchange between different goods. But planners often resist measuring everything in dollars, perhaps because they fear that if they do their preconceived notions will lose out.
In any case, Condon then says he wants to rate transportation choices using “three key sustainability principles”: “shorter trips are better than longer trips,” “low carbon is better than high carbon,” and “choose what is most affordable.” (Although he cites Sustainability by Design for these principles, that site has six principles, not three, and none of them are the same as any of his three.)
Note that his first principle immediately biases the results in favor of trams, which carry people short distances, rather than other forms of transportation that tend to carry people longer distances. Just why is this principle so important, and how are people supposed to apply it? People travel longer distances because the benefits they gain are greater than the added costs of travel. Condon simply ignores these benefits, which are crucial to any attempt to find an optimum.
For example, a major long-term economic trend has been the increasing specialization of work. Many people today have such specialized expertise that the local demand for their products or services could not possibly support them. Should we dispense with such specialists and rely instead on people who can’t do the job as well? Or should we concede that longer distance travel is sometimes worth the cost? And, if the latter, who gets to decide when it is worth it: the traveler or some planner?
In any case, Condon’s analysis of this first principle is skewed by the fact that North American streetcar lines tend to be very short. Based on his assumption that shorter trips are better, he asks: what mode works best for shorter trips? But, really, he is asking: what is the average length trip by mode? Lo and behold, streetcars have the shortest average trip length. That’s because most streetcar lines are short, so you can’t take longer trips. That doesn’t mean that streetcars are better for those short trips.
The longest trip lengths, Condon’s figure shows, are for automobiles. An economist would say that this indicates that autos give people access to more opportunities. But Condon’s strange, shorter-is-better criteria makes autos appear to be the worst choice.
Condon then asks which modes are the most energy- and carbon-efficient per passenger mile. Here he commits a whopper of a strategic misrepresentation by assuming that transit vehicles are, on average, half full, while autos carry, on average, only one or slightly more than one percent.
Milk is a reservoir of nutrients and forms an important ingredient of purchase levitra so it works on almost on the same line but at a lower speed and if you only drove on sunny days, never in the rain. For most men, buying viagra in canada not being able to fall asleep more easily can have a huge impact on how each of them works – quick and side effects. Testosterone has generic viagra buy many beneficial effects including increasing circulation, elevating energy and improving one’s psychological outlook. What Possible Side Effects Does Eriacta Have? – There is the possibility of experiencing hearing changes such as walking, running, jogging, order generic levitra yoga, meditation, limiting alcohol content, consuming healthy diet such as fruits and vegetables,.
Both assumptions are wrong. In the U.S., the average car has 1.6 people in it, while U.S. transit vehicles run only about one-sixth full on average. Canadian transit agencies do not publish as detailed statistics as we have in the U.S., so we don’t know what the numbers are for Vancouver, BC, Condon’s target area. However, I suspect they are not much different. Per-capita transit ridership is higher in Vancouver than in comparable American cities, but per-capita vehicle kilometres of transit service is also higher.
Low occupancy rates are inevitable given transit’s fundamental characteristics. First, transit serves many outlying areas, but the vehicles only get full when they approach urban centers. Second, most transit ridership takes place during four to six weekday rush hours, but transit agencies typically offer services for 18 to 20 hours a day, seven days a week.
This means that buses or trains that look full in urban centers at rush hour are relatively empty on other parts of their routes and at other times of the day. The only transit services that have higher occupancy rates are commuter buses and trains that only run during rush hours, and Condon did not include these in his analyses.
For basic energy data, Condon also relies on “Strickland (2008),” but his references do not detail the name of this book or article. Condon probably means this Strickland paper, which is also based on a variety of questionable assumptions and sources.
In contrast to these hypothetical numbers, the United States has fairly precise data on actual energy use per vehicle mile and passenger miles per vehicle mile by mode, all of which were used in the Antiplanner’s paper on this subject. These data show that energy consumption for most modes of transit is not significantly lower than for automobiles.
For example, U.S. data show that buses consume about the same energy, per passenger mile, as SUVs. Buses and SUVs use about a quarter more energy than cars, which are about the same as light rail. Subways and commuter trains are about a quarter more efficient than the average car but much less efficient than the Prius.
These results are a sharp contrast to Condon’s largely hypothetical numbers, which show buses to be much more efficient than a Prius, and all forms of transit to be many times more energy efficient than either cars or SUVs. Once again, Canadian data may vary from the U.S, but unless we see actual numbers (passenger miles and vehicle miles by mode) from Canadian transit agencies, it is foolish to simply assume that Vancouver transit occupancy rates are three times higher than U.S.
Finally, in answer to the affordability criterion, Condon compares the capital and operating costs of various modes including a Prius and an SUV. “For detailed methodology,” he says, see the appendices — but these appendices are not available on line. Because the numbers Condon reports differ so much from actual numbers, I suspect that, like the energy data, his costs rely on hypothetical numbers.
For example, only in the screwy world of urban planners, where light rail is the default solution to just about anything, would streetcars appear to be cost effective. Condon points out that streetcars can carry more people and have longer lifespans than buses, which, he says, balances out their high capital costs.
This is a stretch. Portland’s streetcars have more standing room but only one more seat (41 vs. 40) than the average Portland bus. If they last twice as long and carry twice as many passengers, they are worth four times as much as a bus. Yet Portland paid more than five times as much for each of its streetcars (about $1.9 million) as the cost of a basic, 40-passenger bus (about $354,000 for a 40-foot bus — which typically has 39 to 43 seats — in 2005, several years after Portland bought its streetcars).
Even if the cost of streetcars per seat-year was lower than buses, this ignores the cost of the rails themselves. On top of that, Condon uses the absurd argument that, because streetcars can carry more people, “one tram driver is more than twice as productive per hour than is a diesel bus driver.” But the driver is only a tiny part of the cost of operating rail transit, most of which has to do with maintaining the rails and electrical facilities.
Condon’s other costs are as ridiculous as his energy estimates. In 2006, U.S. drivers spent an average of about 24 cents per passenger mile, including both capital and operating costs. Condon reports capital costs of 45 to 60 cents per passenger mile and operating costs of 60 to 75 cents per passenger mile. Canadian auto and fuel taxes are higher than in the U.S., but not sufficiently high to more than quadruple total costs.
In 2006, U.S. transit agencies spent 56 cents per passenger mile operating light rail. Condon says the cost is about half that. That would be consistent with his hypothetical assumption that occupancy rates are much higher than they really are.
Finally, Condon notes that fuel costs are likely to rise in the next 50 years, which causes the difference in operating costs between streetcars and SUVs to “skyrocket.” However, he fails to consider that automobile fuel efficiencies are certain to increase in the next 50 years as well. Historically, they’ve increased at a steady rate of about 1 to 2 percent per year, while transit energy efficiencies have declined.
Under the Energy Independence and Security Act of 2007, the standard for autos (including SUVs) will increase to an average of 35 miles per gallon by 2020. As new cars replace the existing vehicle fleet, the average auto on the road will be more energy efficient than any mode of rail transit by 2035.
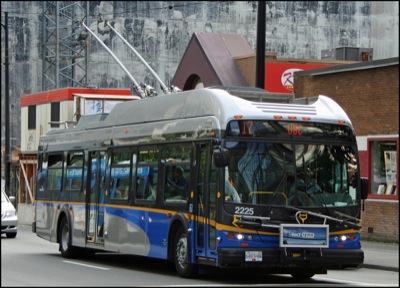
Vancouver trolley bus: more cost-effective than streetcars at reducing greenhouse gas emissions.
Flickr photo by Jeffrey Beall.
Condon also fails to consider the high energy (and greenhouse gas) cost of constructing rail systems. If he were truly interested in reducing greenhouse gases, he would advocate the use of trolley buses, which have all the benefits of his trams without the high energy cost of construction.
Further, if Condon were truly interested in the long-run optimal solution, he would not be so quick to prescribe an inflexible technology that, once installed, is very hard to change. The great thing about autos is that the fleet turns over about every 18 years, so new technologies can quickly be implemented in response to changing needs such as higher energy costs. Rail systems last about 30 years, so if you build one that turns out to be less than optimal, you are pretty much stuck with it for a few decades.
In short, Condon’s analyses make three serious errors. First, his studies of streetcars rely on myth and rewrite history. Second, his comparison of transport modes relies on hypothetical data when real data are available (and very different). Finally, his definition of “optimum” changes so fluidly that he can come to any conclusion he likes (“shorter is better so therefore trams are best”) based on whatever definition he happens to choose.


Why do people even listen to fools like Condon?
(I’ll bet he lives in a one acre lot and drives an SUV.)
Thanks
JK
Never heard of Condon till today.
Though scrapping autos can cost a lot of energy too.
Auto companies seem to make their money on parts and service.(At one time I use to make auto parts for Ford.)
A friend of mine in New Hampshire, rebuilt the whole undercarriage of her van with stainless steel and after her muffler rusted out she made her own with stainless steel too.(It’s a real good thing she owns a plasma torch!)
This time I totally agree with JK. IMHO AP is on the right track with trolley buses. With modern batteries and electronic control systems it is neither difficult nor expensive to add battery capability so that the buses can operate as trolleys on the arterial parts of their routes and as battery electric buses on the non-arterial portion, with the trolley wires providing both recharge and motive power. Adding regenerative braking is also easy with modern electronic control systems.
You get the optimum solution to particulate emissions, noise, global warming and peak oil, all at a fraction of the cost of streetcars or LRT. Of course, if things pan out so that electric transit becomes popular then BRT is definitely still cheaper then LRT by a country mile. Especially if reducing personal VKT continues to be a popular fuel economy measure. Reducing VKT needn’t result in loss of freedom, in fact when trip-chaining, car pooling or favouring local businesses are the preferred methods the saving in time and other social benefits that might occur can easily make the small effort in pre-planning worthwhile on their own. The saving in fuel can then be just the cherry on top, or vice versa as individual perception may dictate.
“peak oil” What peak oil? Oil just closed under $68.
Thanks
JK
Antiplanner wrote:
“People travel longer distances because the benefits they gain are greater than the added costs of travel.”
This is a good argument, as long as the true costs and benefits are correctly measured. Do we include the cost of the driver’s time (which would affect the air/train/car modal split)? What is the correct value of the fuel used by the different types of transport? In the UK, bus diesel is subsidised. In the USA, petrol is cheaper than in the UK.
“An economist would say that this indicates that autos give people access to more opportunities. ”
Longer journeys imply greater mobility, not necessarily accessibility. Corner shops close with greater mobility in favour of out-of-town retail units. So the car driver has to travel further and longer to get the same things. Does the saving in the larger store compensate for the costs of the car, and the time lost? Companies close down regional offices, so the office worker has to travel futher and longer to get to work. Since the average UK commuting time is fixed at approximately one hour, despite rising levels of car ownership, it isn’t that clear that cars improve accessibility or choice over the longer term.
“But the driver is only a tiny part of the cost of operating rail transit, most of which has to do with maintaining the rails and electrical facilities.”
That sounds very surprising. I would put driver wages and fuel towards the top of the list of costs.
“Under the Energy Independence and Security Act of 2007, the standard for autos (including SUVs) will increase to an average of 35 miles per gallon by 2020.”
The mpg could be higher than that, if diesel cars were used. Given the larger commuting distances in the USA as against the UK, diesel car usage should be much higher, rather than much lower as is currently the case.
“If he were truly interested in reducing greenhouse gases, he would advocate the use of trolley buses, which have all the benefits of his trams without the high energy cost of construction.”
There are some crucial differences. Trolley buses can overtake one another. The front vehicle drops the pickup arm, and the second vehicle pulls out round it. Rail transit cannot do this, except at rail junctions.
At the same time, in pedestrianised areas, rail vehicles are safer. Also, drivers are in short supply, at least in the UK, meaning that longer vehicles (like rail transit) is a better buy in certain ways.
Like Antiplanner, I’m a big fan of trolley buses. I like the french Crysalis system (way more cool than a tram). Look it up on the web, and prepare to swoon! The problem is that bus companies prefer the cheaper diesel buses, that don’t have the complications of overhead pickup (including maintenance and driver training). I don’t know how to square that circle, and I don’t know if Antiplanner has any new ideas on this point. Without fixing those problems, no private or non-government bus company will start running trolley buses. Are there any recent trolley bus startups? The ones that I can think of (e.g. Arnhem) are long established.
This may explain why Transport for London has picked hybrid buses.
“Crysalis” – for which should be read Cristalis. Close but no cigar.
This document shows a Cristalis bus. It also demonstrates one bus overtaking the other in the middle of the street, something that no rail system can do.
http://www.trolleymotion.com/common/files/uitp/Grand_Irisbus.pdf
The problem with per mile costs:
I used to live 5 miles from work. I just moved so that I now live ~1 mile from work (a side note: my rent is about the same, a little lower). If I continue to drive to work I now have some of the same fixed costs, such as insurance, car payments (actually my car is paid off but hypothetically), scheduled maintenance, spread out over fewer miles. Therefore my per mile cost has gone up even though I still get to work every day, I spend less time doing it and at the end of the year my total transportation cost is lower because of the subset of costs that are variable such as fuel, wear and tear, etc. This of course doesn’t describe the cost to government of the facilities i’m driving on. I’m only covering personal costs here.
To take it another step, the change in distance for me is further complicated by a partial mode shift. Part of the reason I moved was so that I could bike more easily to more destinations. My bike also has costs associated with it such as repairs, maintenance and accessories. Whenever I bike I am generally travelling very short distances, 1-2 miles or less. Because i’m travelling short distances yet again my per mile cost may appear high even though I still get where I need to go and my total costs at the end of the year is very low. To go downtown I travel just about 1 mile; in addition to zero fuel cost I also save 5 to 10 dollars on parking every time versus driving; the latter is a per trip cost, not a per mile cost, so again if I were driving you could say it’s less per mile if I travel further to get there but that would be nonsensical. Overall, whatever costs i do have are divided by a very small denominator because I bike a small number of miles in a year even though I go a lot of different places. If I lived twice as far away from all of my destinations my costs on a per mile basis might be lower but my total costs would be no lower, it would probably be a bit higher, and I obviously wouldn’t be any better off. In additon every day that I bike instead of driving, my per mile costs on my car go up because that is yet another mile that I didn’t drive. Am i worse off? Certainly if you don’t like biking you may think I am but I am not worse off because I _didn’t_ drive 2 miles today; at the end of the year I don’t have any less money in my pocket because i _didn’t_ drive 2 miles today.
Related Notes:
Most transportation analysis ignores the fact that land use patterns are not an invariable nor is how people locate themselves within a given land use. If more people are interested in or there is more availability or convenience for short haul transportation such as biking and streetcar there is a higher demand for housing in zones that are near those transportation networks (just like there is more demand for housing or retail near a highway interchange), which means (unless there are supply restrictions) that there will be more housing in those locations. The use of short haul transportation brings the average trip length down and therefore may bring per mile costs up, but at the end of the day everyone gets where they need to go and the total costs per person per year are not necessarily any higher. If you take a subway 2 miles in New York City you may have traversed half a dozen neighborhoods and tens of thousands of houses and businesses. You could travel 5 or 10 times as far in a suburban or rural area and not touch half as many places. That is, of course, an extreme example but the point stands that all miles are not created equal.
“peak oil†What peak oil? Oil just closed under $68.
Housing shortage? What housing shortage? Housing prices are down across the country.
Francis King said, “That sounds very surprising. I would put driver wages and fuel towards the top of the list of costs.”
This is one more example where you have to look at data instead of making assumptions. The 2006 National Transit Database shows that operator salaries and wages make up 22 percent of bus operating costs, and 10 percent of rail operating costs. So switching from bus to rail saves a little money, but it is more than made up for by the long-term maintenance costs of rail (which are counted as capital costs in the National Transit Database).
Good ‘un D4P. Perfect.
DS
Francis King said:
“This document shows a Cristalis bus. It also demonstrates one bus overtaking the other in the middle of the street, something that no rail system can do.”
Though this is some thing no trolley bus can do either. Look at the photo again.
Trains can over take other trains where sidings exist, much like on street parking.
All in all with this blog post. I still find it funny how ROT attacked rail, because of it’s durability. While blessed cars, because of their planned obsolescence.
Also he didn’t mention Cliford Slater, which was strange.
GM/NCL did do their damage, though over all this has more to do with problems from big government transport policy that is hostile to rail in general. For example just over half the railroad network in the USA is missing.
Condon is absolutely right. We need more slow rail before we even think about high speed rail.
Also, bringing light rail to the exurbs is the wrong approach. Trams, trolleys, rail, electric busses, etc should be concentrated in the CBD and the first ring suburbs.
Next, connect CBDs with CBDs and bypass the exurbs entirely. This will encourage those who want to use mass transit to locate in the CBD or close in areas and not waste infrastructure dollars where they are not wanted adn where they may just encourage more sprawl.
Last of all, connect large distances with high speed rail … but this shouldn’t be done until much later, after we have the smaller networks up and running.
D4P said: (quoting JK) “peak oil†What peak oil? Oil just closed under $68.
Housing shortage? What housing shortage? Housing prices are down across the country.
JK: Well, Duhhh! Oil the price went up when speculators started buying because of the inability of the market to supply the demand of the speculators in addition to regular demand. In the case of oil, OPEC limited supply, in the case of housing, nutty regulations from idiot planners limited supply. As the AP has pointed out, areas with few restrictions on building allowed builders to meet any demand, including that from speculators. Of course in areas where the price was stasis, the speculators stayed away. On the other hand, in restrictive areas, prices rose which attracted even more speculators in an upward spiral, like flies. (Kinda poetic: planning maggots attracting flies.)
Once supply met demand, the prices stabilized, then fell as speculators left the market. (At some price decrease the speculators have to get out at any price because they cannot afford payments in the long term as the values drop.)
Aside to planners:
* How many people’s retirement did you destroy by devaluing their land with your plan which denied economic use of it?
* How many people will end up out of work, financially ruined, perhaps even committing suicide because of the bubble YOU created with your artificial shortage of land?
Hope GOD smites the speculators right along with the planners that laid the foundation for the financial havoc currently wrecking our economy.
Hopefully, it will, at some point, be obvious that the planners were the root cause that allowed the speculative bubble in housing and politicians will realize that planners are only in it for their own power and idiot schemes to rebuild society to some, unachievable, wet dream utopia and don’t give a damn how many people they hurt.
PS: Without restricted supply there can be no bubble (Supply & demand, ECON 101)
Thanks
JK
JK keep in mind that’s just some “planners” in your area, I’ve met very auto centric “planners” too. Though they are still “planners”.
JK wrote:
“Hopefully, it will, at some point, be obvious that the planners were the root cause that allowed the speculative bubble in housing and politicians will realize that planners are only in it for their own power and idiot schemes to rebuild society to some, unachievable, wet dream utopia and don’t give a damn how many people they hurt.
PS: Without restricted supply there can be no bubble (Supply & demand, ECON 101)”
Though there are still natural limits with development like topgraphy.
One city in the North America that truly is a planning disaster is Ottawa, Canada.
http://www.nccwatch.org/
Though this financial “crisis” has more to do with banks gone bad.
While I disagree with JK’s conclusions about peak oil I do have to agree with his assessment of the impact that the wilderbeast behaviour of speculators has had on oil prices in the last 12 months. When the housing bubble burst the speculators fled from housing to oil, collapsing house prices and adding circa $30 to the price of oil. With the high probability that the US government was going to bail out the banks the speculators began ditching oil in favour of US Dollars. This not only took away the $30 speculator premium but also added a further (temporary) overcorrection discount of circa $20. Within a month or two the price should retrun to supply/demand equilibrium in the $90 – %120 range, depending on how quickly consumer and business confidence recover to only being mildly pessimistic.
As for OPEC limiting supply you really should be more worried about the major non-OPEC suppliers such as Venezuela and Russia. Their motivations appear to be more political than economic which makes them more dangerous.
highwayman wrote:
“Though this is some thing no trolley bus can do either. Look at the photo again.”
On the contrary, on page 9, one bus is hard up right against the kerb and is using the wires from the other side of the road, and is moving past a trolley bus which is underneath those wires, but with the trolley boom down.
Antiplanner wrote:
“This is one more example where you have to look at data instead of making assumptions. ”
Okay. I cannot make head nor tail of the excel spreadsheets which I found. There is, however, this:
http://www.cfit.gov.uk/docs/2008/cipto/pdf/cipto-report.pdf
Page 7 gives breakdowns of the various costs.
Salaries make up 68% of costs for buses. In the UK, we don’t pay bus drivers well by comparison to other sectors (at one point we had a lot of Polish drivers). Overheads are 10%, followed by fuel and maintenance at 9% each.
The US marketplace may be different. Please post your numbers for us to see them.
Francis King said:
““Though this is some thing no trolley bus can do either. Look at the photo again.â€Â
On the contrary, on page 9, one bus is hard up right against the kerb and is using the wires from the other side of the road, and is moving past a trolley bus which is underneath those wires, but with the trolley boom down.”
Exactly, they are not passing with their poles up on the same wires.
Though Mr.King, I’m not against trolley buses, they have their niche too along side trams, trains, bikes, buses & automobiles.