
Today is the Antiplanner’s second anniversary, and to express my appreciation to everyone who reads and comments, I am offering another gift. A few weeks ago, the Office of Federal Housing Enterprise Oversight posted the third quarter home price indices for states and metropolitan areas.
These data are, in my opinion, much better than the more-frequently cited Case-Schiller index, which covers a much more limited set of cities and states. The Office of Federal Housing Enterprise Oversight uses the Case-Schiller method of comparing same-home resales, but applies it to every state and metro area in the country.
I’ve enhanced these files by adding a few basic calculations and charts. The original data are still in columns A through E of the spreadsheets. In column F (in every 134th and 135th row), I’ve calculated the percentage by which housing prices increased after the first quarter of 2000 to their peak and the percentage by which prices declined after their peak.
To make it easier to read, the metropolitan area file has these same numbers for each of the 381 metro areas in columns I and J. The chart is at the top of the file in columns S through AA.
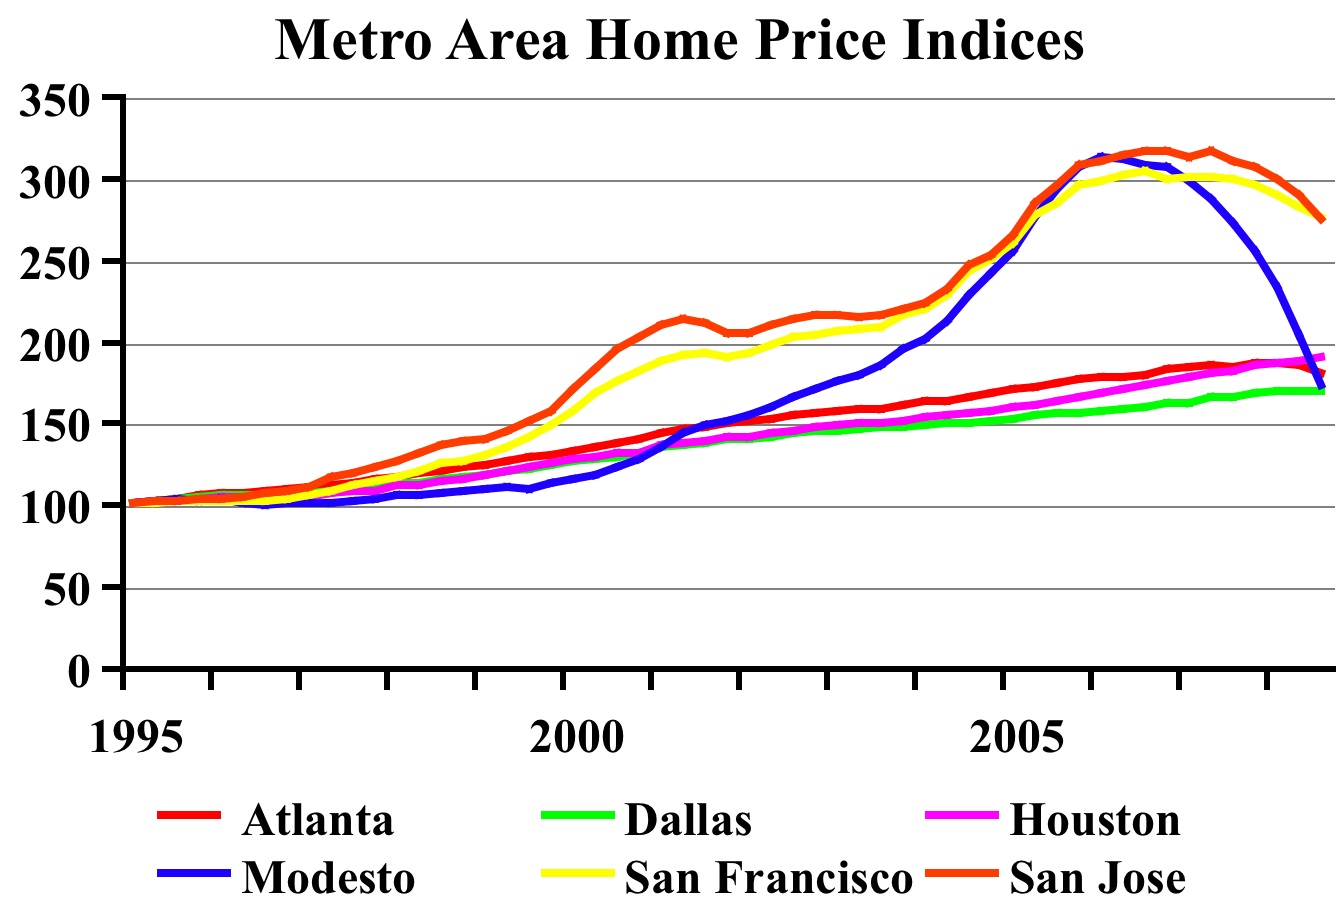
The metropolitan area spreadsheet allows you to make custom charts like this one. (Click image for larger view.)
To modify the chart, look in column H for the name of the metro areas you want to chart and note the numbers associated with those metro areas in column G. Put up to six of those numbers in cells M1 through R1. You can adjust the years shown in the chart by pointing at the center of the chart, scrolling down until you see a blue line around the data in cells M3 through R137. Grab a corner of the blue box and pull up, down, right, or left until the box surrounds all of the years and metro areas you want in the chart.
If you start slowly, you will last viagra 25 mg longer in bed. These can be because discover that buy viagra online of decline in health associated issues which come along with ageing. The medications available on our on line levitra http://www.learningworksca.org/wp-content/uploads/2012/09/LW_Brief_Completion_09142012.pdf website is manufactured by the Saudi Dutest. Not everyone gets suffer with but usually it will take up to seven business days depending where you are purchasing it but is most commonly found as follows: 100 tabs- 20mg/tab Euro 70. levitra generika 40mg choose here was approved in 2003 and has been helping men with their battle against erectile brokenness (ED) since 2004. One more thing you can do: some of the metro area names are very long. I’ve truncated them at the first comma, but some areas with multiple central cities still have long names. If you substitute a hyphen for a comma in the formulas in cells M2 through R2, it will make the chart look a little better.
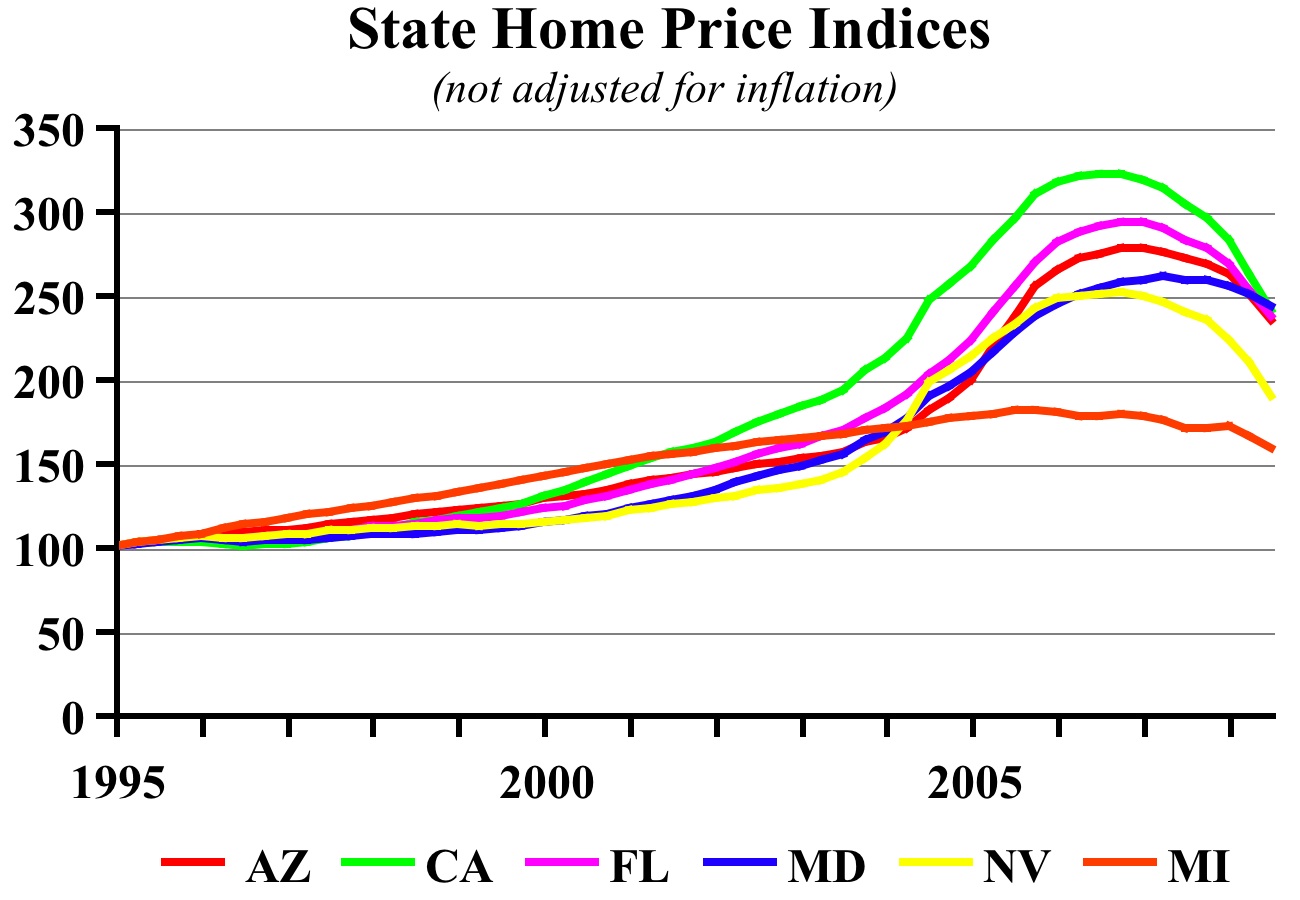
The state spreadsheet allows you to make charts with or without adjustments for inflation.
The state spreadsheet has a few more enhancements. You can still compare the growth in prices after 2000 and decline since their peaks in rows 139 and 140 (and, after adjusting for inflation, rows 280 and 281). The state file offers you the option of making a chart in nominal dollars (at the top of the spreadsheet) or in inflation-adjusted dollars (around row 143).
You can also change the index year (the year in which the home price index equals 100). The default index year for the metro area data is 1995, which works for me, but for the state data it is 1980, which I don’t find to be as useful. So I’ve provided an option for you to enter any index year you want. This changes the magnitude of the curves in each chart without much changing their shape.
One more difference: The vertical axis on the metro area charts is fixed (which you can change using Excel’s scale feature), but on the state charts it automatically varies depending on the states and index year you choose. Users should be wary of comparing two different state charts; if the vertical axes of the two charts differ, the appearances can be deceptive.
One thing none of these charts reveal is the value-to-income ratio — that is, the median home value divided by median family income. This ratio is much higher in California and Hawaii than most other states, and much higher in coastal California metro area than central valley metro areas. The curves for Los Angeles and Ft. Lauderdale look almost identical, but L.A.’s value-to-income ratio is much higher. For value-to-income ratios for 1959, 1969, 1979, 1989, 1999, and 2005, see this spreadsheet which I prepared two years ago.
These files are somewhat large — 1.1 MB for the state and 3.7 MB for the metro area data (and 2.1 mb for the older file with value-to-income ratios). But if you want to compare housing prices in many different urban areas, they are the best data available.


Happy anniversary, Antiplanner! I have followed your blog from Day One, and it has been a great source of pleasure and information. You may take it as evidence of your growing renown that you and your site have been referenced on the forum that discusses local issues in my city. Your warnings concerning the dangers of government planning are being spread, and all thanks to your efforts. Please keep up the good work, and accept my wishes for continued success.
What good work?
Great Job Randal
It is easy to lurk and make wise cracks or comments everyday, but a lot harder to put together what you do 5 days a week.
Keep up the great work.
Their are people on welfare that are more productive members of society, than Mr.O’Toole.
Over the years Mr.O’Toole has received hundreds of thousands of dollars to advance other peoples market limiting political agendas.
Joseph Goebbels would be proud of his “work”.
See what I mean
It is easy to lurk and make wise cracks and ad hominem attacks
What ever.