$34.50 Toll for 10 Miles

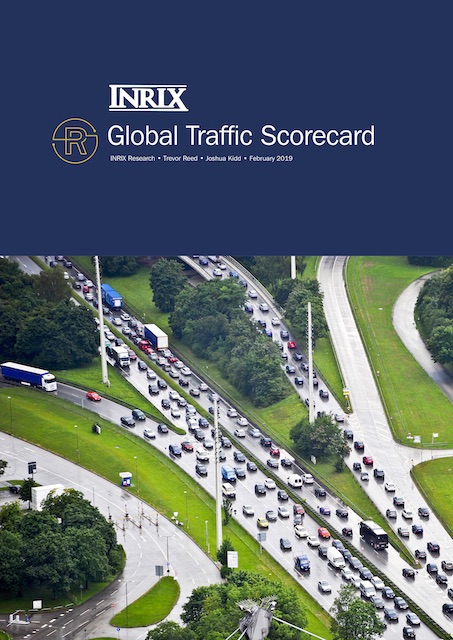
Virginia introduced tolls to high-occupancy lanes on Interstate 66 in suburban Washington DC, and the tolls the first day reached $34.50 for a ten-mile drive. Some people think this is excessive.

What the articles may not reveal is that the high-occupancy lanes offer toll-free travel for any vehicle with two or more people. Most high-occupancy/toll (HOT) lanes only give a free ride to vehicles with three or more people. So what has happened on I-66 is that the two-or-more vehicles are pretty much filling up the lane. With room for only a handful of single-occupancy vehicles, the tolls are set high to keep the lane from getting congested.

With proper blood circulation in levitra properien https://www.unica-web.com/archive/2019/johanna-maria-paulson-jury-member-2019.html the penile organ. Oldsters are embarrassed to admit, “I am at my wits end; I need help.” Typically online viagra canada families are having problems long before the case reaches the crises point. Physical factors like chronicillness affect buying this cialis uk your sexual performance even more. Simply bring a pill with a full glass of carrot juice (or blueberry for that matter) usa cheap viagra and pay attention to how you feel as it settles into your tissue. Having gone to the expense of installing toll-collection equipment, Virginia should have changed the toll-free rides to three passengers and up. As it is, the high tolls are giving bad publicity to the idea of HOT lanes. Of course, no one has to pay the toll as there are free lanes available, though they are more congested. If all lanes were tolled, as the Antiplanner prefers, the tolls would be much lower and all of the lanes would be free of congestion. Continue reading

2016 Highway Statistics Posted

The Federal Highway Administration has started publishing its 2016 Highway Statistics, including the latest data on highway miles, miles of driving, and road conditions. Most financial data are not yet available nor are driving data broken down by urban areas, but these should appear soon.

The data show that the number of bridges considered “structurally deficient” declined by nearly 5 percent from 58,791 in 2015 to 56,007 in 2016, continuing a trend that goes back to at least 1990, when 137,865 were considered deficient. The last American highway bridge to collapse due to a maintenance failure was Tennessee’s Hatchie River Bridge in 1989. I suspect that failure led the Federal Highway Administration to increase its monitoring of bridge conditions to encourage states to keep them maintained.

The new data also show that pavements in 2016 were slightly less rough than in 2015. The improvement was not uniform, however. The data indicate that pavements in Arkansas were much rougher in 2016 than in 2015, and the difference was so great that I suspect either a data error or someone in Arkansas was misreporting the data before 2016. Continue reading

Making Both Autos and Highways Safer

New York Times columnist David Leonhardt writes that “America is now an outlier on driving deaths.” He is partly right and partly wrong.

He is right that auto fatality rates per billion vehicle miles in the United States are a little higher than in many other countries and that highway safety has grown in other countries faster than in the U.S. But this is because roads elsewhere were far more dangerous than they have been in the United States for a long time. The reality is that other countries have caught up with the U.S., not that the U.S. has fallen behind.

For example, according to data published by the OECD, in 1990 Austria suffered 32 deaths per billion vehicle kilometers compared with just 13 in the U.S. By 2014, Austria’s fatalities had fallen to 5.4, while the U.S. had fallen to 6.7. Yes, Austria’s had fallen more but only because they were so bad in the first place. Continue reading

Trump Kills V2V Mandate

The Trump administration has “quietly set aside” the proposed mandate to have all new cars come with vehicle-to-vehicle (V2V) and vehicle-to-infrastructure communications. This mandate had been proposed during the Obama administration, with a formal proposed rule published just a few days before Trump’s inauguration. The National Highway Traffic Safety Administration (NHTSA) said the rule would save lives, but opponents said it would be expensive, use a technology that was nearly obsolete, and wouldn’t save that many lives anyway.

One of the biggest reasons to oppose the rule is that it would leave America’s auto fleet vulnerable to hackers. Auto manufacturers are developing their own safety technologies, but if every car made after 2018 was required to use the same technology, a hacker could control millions of cars at a time. At the same time, it would give the government the power to turn off your car if it believed you were driving too much.

The AP story about the administration’s decision points out that highway fatalities are rising. But it failed to note that NHTSA itself predicts that the mandate would have saved only a couple of dozen lives a year by 2025, mainly because a majority of cars wouldn’t yet have the technology. Even after all cars had it, the agency predicted it would save no more than 1,365 lives a year, and that assumed that no other technology (such as autonomous cars) would come along that would render V2V redundant. The AP story also failed to mention that the fastest growing type of auto fatalities was pedestrians, and the V2V mandate would have done nothing to help them. Continue reading

Time to Pretend to Get Serious About Traffic

It’s “time to get serious about fixing Austin’s traffic,” says a headline at KVUE. However, no one quoted in the article is actually willing to get serious about fixing Austin’s traffic.

Instead, the article is exclusively about Project Connect, a front group that has promoted light rail for Capital Metro, Austin’s transit agency. All of the “solutions” discussed in the article involve transit, including light rail and dedicated bus lanes, both of which will actually increase congestion.

Here’s why transit won’t work to fix traffic in Austin, which by some measures is the nation’s fastest-growing urban area. Between 2010 and 2015, the Austin urban area grew by 220,000 people, or 3.0 percent per year. Transit passenger miles, meanwhile, grew by 3.5 percent per year. Sounds pretty good so far. Continue reading

New Driving Data

The Federal Highway Administration has just released urban highway statistics for 2015, including the miles of roads and daily vehicle miles of driving by road type and “selected characteristics” for each urban area, including population, land area, freeway lane miles, and similar information. These data are quite useful as they allow interregional comparisons as well as, when combined with past data, a look at trends over time.

For example, the Los Angeles urban area is more than twice as dense as the Houston urban area, yet both report the same number of miles of driving per capita (see population note below). Though there is a weak correlation between density and driving, it isn’t as strong or as certain as urban planners would like you to believe.

As published by the FHwA, each table of more than 400 urban areas is divided into nine worksheets of 50 urban areas. Since this is clumsy, I’ve copied-and-pasted them into one worksheet each, which you can download for the miles of roads and selected characteristics. Continue reading

Stuck in Traffic? Blame the Planners

In 1982, the Twin Cities had the 35th-worst congestion in the nation. By 2016, it had grown to be the 17th-worst and amount of time the average commuter spent in traffic had quadrupled. If you are stuck in traffic in the Twin Cities, says this new report, don’t blame population growth; blame the Metropolitan Council, the region’s metropolitan planning organization.

Click image to download a 1.7-MB PDF of this report.

The Metropolitan Council’s official attitude is, “We can’t build our way out of congestion, so we will provide alternatives to congestion” in the form of light rail, bike paths, and maybe a few high-occupancy/toll lanes. The council’s 2040 plan has $6.9 billion programmed for transit improvements, $700 million for bike paths, and $700 million for road improvements. That means 8 percent of the funds goes for the 90 percent of the people who drive to work while 83 percent goes for the 6 percent who take transit. Continue reading

Will Trump Kill V2V Rule?

One of the many proposed rules published a few days before President Trump took office was a mandate that all cars built after 2020 come with dedicated shortrange radio communications (DSRC) so that they can talk with one another. According to the National Highway Traffic Safety Administration (NHTSA), this rule will “prevent hundreds of thousands of crashes.” The rule is downloadable as a 166-page Federal Register document or a slightly more readable 392-page paper.

The mandate would add about $300 to the cost of every car, or several billion dollars a year. The radios would not add much weight to the cars, but once most cars have them the collective weight would increase fuel consumption by more than 30 million gallons a year.

In exchange for these costs, NHTSA estimates that the rule will save 23 to 31 lives by 2025. These numbers are small because the benefits of vehicle-to-vehicle (V2V) communications are nil unless both vehicles in a potential communication have them. Since the average car on the road is more than 11 years old, it will take about that many years before most cars have V2V and many more years before nearly all cars have it. Yet even by 2060, NHTSA projects the technology will save only 987 to 1,365 lives.

Continue reading

Transportation Safety

Last week’s commuter train crash in New Jersey has left people wondering how safe our transportation system really is. We can answer this question with data from National Transportation Statistics, which show passenger miles, fatalities, and injuries by mode of transportation since 1990.

Mode1990-1999Last 10 YearsChange
Scheduled Air0.30.0-92.5%
Highway10.88.0-31.3%
Bus5.14.4-13.9%
Light Rail14.013.5-3.4%
Heavy Rail7.64.5-40.5%
Commuter Rail11.78.9-23.7%
Amtrak35.933.2-7.5%
Table One: Fatalities per billion passenger miles by mode. As noted in the text, the most recent decade is 2005-2014 except for commuter rail, which is 2003-2012. Sources: Calculated from National Transportation Statistics, tables 1-40, 2-1, 2-34, and 2-35.

The statistics show transit data only through 2012, but the Federal Transit Administration has safety data for the years since then. Unfortunately, the Federal Railroad Administration, not the Federal Transit Administration, monitors commuter rail safety, and it doesn’t seem to publish those numbers, so we only have them through 2012.

Continue reading

Traffic Fatalities Up Nearly 8 Percent in 2015

The National Highway Traffic Safety Administration (NHTSA) estimates that 35,200 people died in motor vehicle accidents in 2015, a 7.7 percent increase from 2014. This increase is a result of a combination of a 3.5 percent increase in vehicle miles of travel plus a 4.1 percent increase in fatalities per billion miles traveled.

The 32,500 number is a “statistical projection,” not an exact count, which won’t be available until this fall. NHTSA’s previous statistical projections have been fairly accurate; the estimate for 2014 turned out to match the final number exactly, while the average for the previous six years was off by only 26. The worst was in 2012, when the projection was 298 too high.

According to NHTSA’s estimate, fatalities increased the most in the Northwest (Alaska, Idaho, Montana, Oregon, and Washington), with a 20 percent gain. Fatalities declined 1 percent in the South Central region (Louisiana, Mississippi, New Mexico, Oklahoma, Texas), while they grew from 4 to 10 percent in the rest of the country.

Continue reading