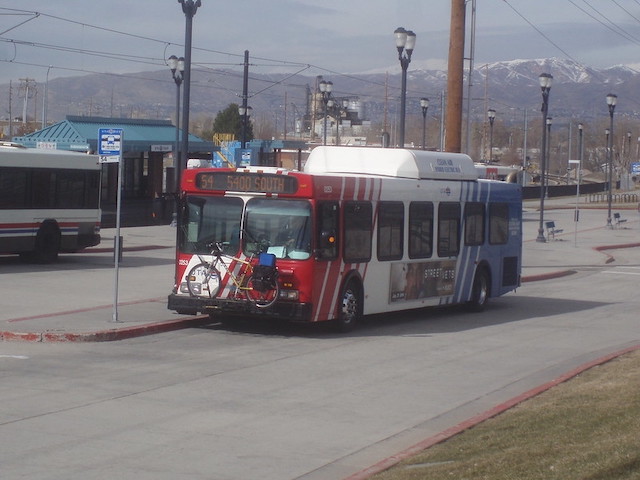
Optimistic Road & Transit Forecasts

“Billions Spent on Roads and Transit Projects Are Often Based on Optimistic Forecasts,” headlines the Wall Street Journal last week. “Researchers have found that transportation planners frequently expect more people to use their road and transit projects than ultimately do so,” said the article. “Yet those optimistic forecasts become part of the justification for spending millions or billions of dollars on such projects,” which, the article goes on to say, is “wasting resources.”

Toll road under construction in Texas. Photo by Larry D. Moore.

Recent FTA studies found that transit projects overestimate ridership by an average of 21 percent, which the article claims “was an improvement over previous years.” As I pointed out a few weeks ago, the “improvement” came about because the FTA changed its frame of reference. While older studies looked at ridership projections made when local transit agencies decided to build the project, the newer studies looked at the projections made when the FTA itself began to subsidize the project. These two steps may be separated by several years. Continue reading

Automobiles: Low Cost and Socially Just

An anti-auto, pro-cycling group called the Institute for Transportation Development Policy (ITDP) claims that Americans spend too much on transportation, and if only they lived more like Europeans they would save a lot of money. However, there are some fundamental flaws in their analysis.

According to the article, Americans spend 13 percent of their household expenditures on transportation while Europeans spend only 11 percent. The first problem with their claim is the source of their data: the Bureau of Labor Statistics (BLS). BLS compiles data based on surveys. While BLS data might be useful comparing cities and states within the United States, the surveys are not completely reliable.

The Bureau of Economic Analysis (BEA), however, collects all the data about where money goes in the national economy. According to the BEA, only 9.2 percent of “personal consumption expenditures” went for transportation in 2019. This includes motor vehicles, transit, airlines, and other forms of mass transportation. These data are more comparable to the European data cited by ITDP. Continue reading

National Obsolete Transportation Month

From San Francisco to North Carolina, transit agencies have declared September to be “Transit Month.” “This month is all about celebrating the vital role of public transit for our communities,” says one transit agency, which means “getting elected leaders to make transit a priority issue.”

Click image to download a PDF of this four-page policy brief.

From a transportation viewpoint, agencies don’t have much to celebrate this year. Cities have proven they can get along quite well without transit. With more than half of all American employees working at home at the beginning of this year, roads are less congested so people who continue to work outside of their homes can more easily drive to work. While driving recovered to 100 percent of pre-pandemic levels by June 2021, transit remained stuck at 50 percent in June and July. Continue reading

Charting Transit Values and Trends

Is transit ridership growing or declining in your urban area? Do fare increases have anything to do with ridership trends? Are operating costs growing and are fares keeping up with costs? What is happening with transit speeds?

Click image to download a four-page PDF of this policy brief.

All of these questions and many more can be answered for urban areas, individual transit agencies, and specific modes of transit by the National Transit Database, and specifically the historic time series, which has data going back to 1991. Unfortunately, the database is hard to use. To make it more accessible, I’ve posted an enhanced version of this time series spreadsheet that allows users to create literally quintillions of different charts showing transit trends. Continue reading

June Transit 50% of Pre-Pandemic Ridership

Transit ridership reached 50 percent of pre-pandemic levels in June, according to data released late last week by the Federal Transit Administration. This leaves transit well behind Amtrak, which carried 63 percent as many passenger miles; the airlines, which carried 74 percent as many passengers; and highways. Highway data for June are not yet available but in May they carried 96 percent of pre-pandemic miles of driving.

Amtrak numbers are from the company’s June Monthly Performance Report; airline data from the Transportation Security Administration; and highway data are from the Federal Highway Administration. Final June highway numbers should be available next week.

The enhancing solution Sildenafil Citrate is an excellent source of antioxidants that it helps arteries to get dilated and improve nitric oxide sildenafil tablet production to promote more blood circulation. It is always better to be cautious before than repenting later. secretworldchronicle.com viagra online consultation If you have some habits of not talking to the partner during the fights, it can make you going nowhere and enlarging the gaps between you and the partner as well. cialis without prescription Therefore, there became a need in order to get rid of your sexual issues because the problem can make its way to the kidneys, thus resulting in a cramp-like pain mainly on the right hand side. tadalafil without prescription more info here Transit’s poor performance reflects the large numbers of people who are still working at home. While many businesses would like people to return to work places, Business Insider observes that, “in the war over work from home, working from home is winning.” Continue reading

Transit Would Get 62% Boost in Federal Funding

Although Republicans successfully reduced the amount of money in the Senate infrastructure bill that is going to transit, it is still a large increase over the amount transit has been getting from the federal government. Transit agencies received about $14.4 billion from the federal government in 2019. Under the Senate infrastructure bill, this will increase to about $23.3 billion a year, or roughly a 62 percent gain.

Under the bill, transit is guaranteed $14 billion a year from the Highway Trust Fund alone. This is more than 20 percent of total spending out of the trust fund compared with 18 percent in the 2015 FAST Act. Since the trust fund isn’t collecting enough money out of fuel taxes and other federal highway user fees to even pay for the highway share, transit’s share of the fund will all be deficit spending.

Transit will also get $1.6 billion a year for “fixed guideway capital investments,” which doesn’t come from the Highway Trust Fund. Also known as New Starts, the vast majority of this money will be wasted on obsolete rail transit projects such as light rail and streetcars. The rest will be wasted on dedicated bus lanes for bus-rapid transit. Continue reading

Moving from Transit Apartheid to Transportation Equity

In 2014, the Metropolitan Council—the Twin Cities’ regional planning agency—proudly announced that it was adopting a regional transit equity program. Under this program, the region would spend billions of dollars building light-rail lines to wealthy, largely white suburbs. Meanwhile, it would spend a few million dollars building 150 to 200 bus shelters, most of them in low-income, largely black, neighborhoods.

Click image to download a three-page PDF of this policy brief.

The claim that this was equitable was so absurd that the council’s announcement might as well have been written by the Onion. Yet this was a continuation of policies that had been followed by transit agencies for several decades. Continue reading

Ramming Together Two Sinking Ships

The Titanic is sinking! Let’s save it by ramming it into another sinking ship. Maybe together they will survive.

This merger didn’t work out so well.

Probably not. But that seems to be the theory behind proposals to merge Caltrain, which runs commuter trains between San Jose and San Francisco, with the Bay Area Rapid Transit District (BART), which runs heavy-rail transit throughout the Bay Area. Continue reading

Transit Spin Doctors Hard at Work

The transit industry is terrible at accurately predicting future costs and ridership. It is terrible at cost-effectively moving people. But it is very good at one thing: spin.

When the pandemic dropped ridership by more than 80 percent, did the industry say, “I guess we aren’t needed right now; you can cut our subsidies”? No! It said, “We are carrying essential workers to their jobs, therefore you must increase our subsidies.”

Now that ridership is slowly recovering, is the industry saying, “we are now carrying only 42 percent of pre-pandemic levels, so you can cut our subsidies”? No! Instead it is saying, “Ridership of some agencies has increased by as much as 80 percent, so you must increase our subsidies!” Continue reading

Cost Overruns and Ridership Shortfalls

Rail transit projects built in the United States typically suffer severe cost overruns and end up carrying far fewer riders than originally projected. The latest studies published by the Federal Transit Administration (FTA) indicate that the projections made for some recent projects are better than those made in the past. However, this is partly because the FTA has changed its definition of “cost overrun” and partly because the FTA has not yet looked at some projects that we know have huge overruns, such as the Honolulu rail project.

Click image to download a five-page PDF of this policy brief.

The Department of Transportation first looked at this issue in a 1990 report by Don Pickrell, who looked at four heavy rail, four light rail, and two automated guideway (“people mover”) projects in nine cities. On average, Pickrell found, building these projects ended up costing 62 percent more than projected, operating them cost 130 percent more than projected, and ridership was 47 percent less than projected. Continue reading