
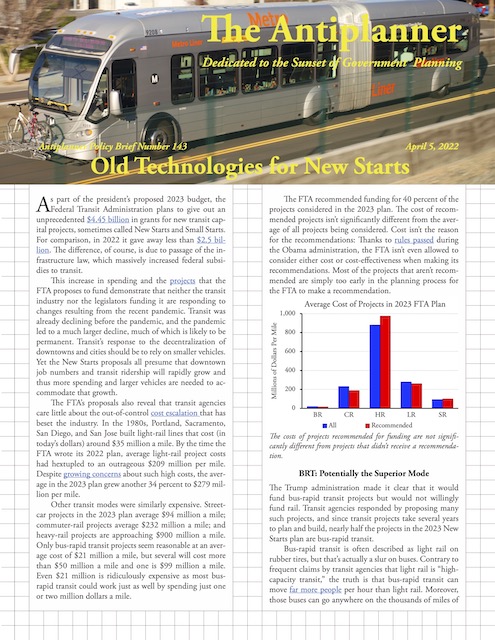
As part of the president’s proposed 2023 budget, the Federal Transit Administration plans to give out an unprecedented $4.45 billion on new transit capital projects, sometimes called New Starts and Small Starts. For comparison, in 2022 it gave away less than $2.5 billion. The difference, of course, is due to passage of the infrastructure law, which massively increased federal subsidies to transit.
 Click image to download a five-page PDF of this policy brief.
This increase in spending and the projects that the FTA proposes to fund demonstrate that neither the transit industry nor the legislators funding it are responding to changes resulting from the recent pandemic. Transit was already declining before the pandemic, and the pandemic led to a much larger decline, much of which is likely to be permanent. Transit’s response to the decentralization of downtowns and cities should be to rely on smaller vehicles. Yet the New Starts proposals all presume that downtown job numbers and transit ridership will rapidly grow and thus more spending and larger vehicles are needed to accommodate that growth.
The FTA’s proposals also reveal that transit agencies care little about the out-of-control cost escalation that has beset the industry. In the 1980s, Portland, Sacramento, San Diego, and San Jose built light-rail lines that cost (in today’s dollars) around $35 million a mile. By the time the FTA wrote its 2022 plan, average light-rail project costs had hextupled to an outrageous $209 million per mile. Despite growing concerns about such high costs, the average in the 2023 plan grew another 34 percent to $279 million per mile.
Other transit modes were similarly expensive. Streetcar projects in the 2023 plan average $94 million a mile; commuter-rail projects average $232 million a mile; and heavy-rail projects are approaching $900 million a mile. Only bus-rapid transit projects seem reasonable at an average cost of $21 million a mile, but several will cost more than $50 million a mile and one is $99 million a mile. Even $21 million is ridiculously expensive as most bus-rapid transit could work just as well by spending just one or two million dollars a mile.
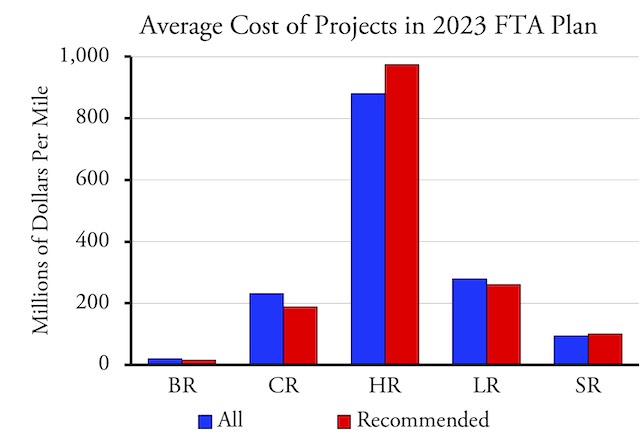
The costs of projects recommended for funding are not significantly different from projects that didn’t receive a recommendation.
The FTA recommended funding for 40 percent of the projects considered in the 2023 plan. The cost of recommended projects isn’t significantly different from the average of all projects being considered. Cost isn’t the reason for the recommendations: Thanks to rules passed during the Obama administration, the FTA isn’t even allowed to consider either cost or cost-effectiveness when making its recommendations. Most of the projects that aren’t recommended are simply too early in the planning process for the FTA to make a recommendation.
FTA 2023 Transit Capital Projects
| Urban Area | Project | Mode | Est. Cost | Miles | Cost/mile |
|---|---|---|---|---|---|
| Los Angeles | Inglewood Connector | AG | $1,150.0 | 1.6 | $718.8 |
| Flagstaff | Transit Spine | BR | 32.9 | 13.0 | 2.5 |
| Monterey | SURF! | BR | 55.0 | 6.0 | 9.2 |
| San Bernardino | West Valley | BR | 262.7 | 19.0 | 13.8 |
| Denver | Colfax | BR | 250.0 | 9.9 | 25.3 |
| Fort Collins | West Elizabeth | BR | 73.4 | 3.0 | 24.5 |
| Miami | E-W 1 | BR | 281.0 | 13.5 | 20.8 |
| Miami | NW | BR | 414.0 | ||
| Atlanta | Clayton Southlake | BR | 338.1 | 15.5 | 21.8 |
| Indianapolis | Blue Line | BR | 220.0 | 24.0 | 9.2 |
| Rochester | Rochester | BR | 114.5 | 2.6 | 44.1 |
| Minneapolis | Gold | BR | 531.9 | 10.3 | 51.6 |
| Minneapolis | Purple Line | BR | 445.0 | 15.0 | 29.7 |
| Chapel Hill | North-South | BR | 141.4 | 8.2 | 17.2 |
| Raleigh | Wake-New Bern | BR | 71.5 | 5.1 | 14.0 |
| Raleigh | Wake-Southern | BR | 109.5 | 5.0 | 21.9 |
| Raleigh | Wake-West | BR | 180.0 | 12.0 | 15.0 |
| Las Vegas | Maryland Parkway | BR | 287.0 | 7.3 | 39.3 |
| New York | Woodhaven | BR | 258.8 | 6.1 | 42.4 |
| Cleveland | Metrohealth | BR | 50.0 | 4.0 | 12.5 |
| Columbus | East Main | BR | 225.0 | 13.0 | 17.3 |
| Columbus | West Broad | BR | 185.0 | 8.5 | 21.8 |
| Pittsburgh | DT-UT-Oakland-East End | BR | 249.9 | 15.0 | 16.7 |
| Charleston | Lowcountry | BR | 387.5 | 26.0 | 14.9 |
| Memphis | Innovation Corridor | BR | 73.3 | 8.0 | 9.2 |
| Austin | Expo | BR | 35.6 | 12.0 | 3.0 |
| Houston | University | BR | 1,560.0 | 25.3 | 61.7 |
| Austin | Pleasant Valley | BR | 36.6 | 14.0 | 2.6 |
| San Antonio | North/South | BR | 320.0 | 11.7 | 27.4 |
| Waco | Waco | BR | 18.9 | 13.3 | 1.4 |
| Salt Lake | Midvalley | BR | 105.5 | 7.0 | 15.1 |
| Washington | Alexandria W. End | BR | 129.5 | 5.3 | 24.4 |
| Washington | Fairfax Rchmd. Hwy. | BR | 730.0 | 7.4 | 98.6 |
| Seattle | Rapid K | BR | 89.6 | 15.7 | 5.7 |
| Seattle | Madison | BR | 133.4 | 2.3 | 58.0 |
| Seattle | Tacoma Pacific Ave. | BR | 170.0 | 14.3 | 11.9 |
| Seattle | Rapid I | BR | 141.1 | 17.0 | 8.3 |
| Seattle | Rapid J | BR | 120.6 | 5.2 | 23.2 |
| Madison | East-West | BR | 160.0 | 15.5 | 10.3 |
| San Francisco | Caltrain Electrification | CR | 1,930.7 | 51.0 | 37.9 |
| San Francisco | Transbay Extension | CR | 4,700.0 | 2.4 | 1,958.3 |
| Orlando | Airport | CR | 200.0 | 5.5 | 36.4 |
| Chicago | NW IN Double Tracks | CR | 491.1 | 26.6 | 18.5 |
| Lake County IN | West Lake | CR | 944.9 | 7.8 | 121.1 |
| New York | Hudson Tunnel | CR | 12,685.5 | 6.5 | 1,951.6 |
| New York | Portal North Br. | CR | 1,732.2 | 2.4 | 709.9 |
| Washington | N. VA Core Capacity | CR | 2,415.0 | 6.0 | 402.5 |
| Los Angeles | Westside Purple Ext. 1 | HR | 2,822.0 | 3.9 | 719.9 |
| Los Angeles | Westside Purple Ext. 2 | HR | 2,499.2 | 2.6 | 965.0 |
| Los Angeles | Westside Purple Ext. 3 | HR | 3,599.3 | 2.6 | 1,406.0 |
| San Jose | BART II | HR | 9,148.0 | 6.0 | 1,524.7 |
| San Francisco | Transbay Capacity | HR | 2,705.7 | ||
| Chicago | Red Line Ext. | HR | 2,500.0 | 5.6 | 446.4 |
| Chicago | Red/Purple Modification | HR | 2,066.7 | 5.6 | 369.1 |
| New York | Canarsie | HR | 372.9 | 6.0 | 62.2 |
| New York | Second Ave. Phase 2 | HR | 6,948.7 | 1.8 | 3,948.1 |
| Phoenix | NW Phase 2 | LR | 401.3 | 1.6 | 250.8 |
| Phoenix | South Central | LR | 1,345.1 | 5.5 | 244.6 |
| Los Angeles | East SF Valley 1 | LR | 2,810.0 | 6.7 | 419.4 |
| Los Angeles | West Santa Ana | LR | 5,000.0 | 14.8 | 337.8 |
| San Diego | Mid-Coast | LR | 2,171.2 | 10.9 | 198.8 |
| Boston | Green Line Extension | LR | 2,297.6 | 4.7 | 488.9 |
| Washington | Purple Line | LR | 2,407.0 | 16.2 | 148.6 |
| Minneapolis | Blue Line Ext. | LR | 13.5 | 0.0 | |
| Minneapolis | Southwest | LR | 2,003.2 | 14.5 | 138.1 |
| Portland | Southwest | LR | 2,700.0 | 12.0 | 225.0 |
| Philadelphia | King of Prussia | LR | 2,082.0 | 3.8 | 547.9 |
| Austin | Blue | LR | 2,000.0 | 8.2 | 243.9 |
| Austin | Orange | LR | 3,800.0 | 12.0 | 316.7 |
| Seattle | Federal Way | LR | 3,160.7 | 7.8 | 405.2 |
| Seattle | Lynnwood | LR | 3,260.4 | 8.5 | 383.6 |
| Los Angeles | Historic Streetcar | SR | 296.4 | 3.4 | 87.2 |
| Sacramento | Downtown Riverfront | SR | 117.0 | 1.5 | 78.0 |
| Tampa | Extension | SR | 234.5 | 4.0 | 58.6 |
| Kansas City | Main Street Extension | SR | 351.7 | 3.5 | 100.5 |
| Seattle | Center City | SR | 285.5 | 1.3 | 219.6 |
All dollars are in millions. Projects in bold face are recommended for 2023 funding. Project descriptions are available on the FTA web site.
BRT: Potentially the Superior Mode
The Trump administration made it clear that it would fund bus-rapid transit projects but would not willingly fund rail. Transit agencies responded by proposing many such projects, and since transit projects take several years to plan and build, nearly half the projects in the 2023 New Starts plan are bus-rapid transit.
Bus-rapid transit is often described as light rail on rubber tires, but that’s actually a slur on buses. Contrary to frequent claims by transit agencies that light rail is “high-capacity transit,” the truth is that bus-rapid transit can move far more people per hour than light rail. Moreover, those buses can go anywhere on the thousands of miles of streets that are found in any major urban area, while light-rail cars can only go where someone has spent hundreds of millions or billions of miles building rail lines.
Unfortunately, transit agencies rarely make full use of these advantages of buses. The Istanbul Metrobus runs as frequently as every 14 seconds. The Lincoln Tunnel between Manhattan and New Jersey has an exclusive bus lane that, prior to the pandemic, carried as many as 730 buses per hour, or one every five seconds. Yet many U.S. transit agencies plan to operate their bus-rapid transit routes only every 10 to 15 minutes. Los Angeles operates its G line at most every six minutes, meaning it could increase bus frequencies by 25 times—yet it plans to convert it to light rail on the specious claim that this would increase its capacity. Furthermore, instead of having buses fan out to various neighborhoods in the corridor they serve, agencies typically buy special buses that only run on the BRT route and force people to transfer to local buses along the way.
Like many bus-rapid transit lines in the U.S., the buses running on Los Angeles’ G line never leave the lanes dedicated to it, thus losing the advantage that buses can serve more people by fanning out onto any streets. Photo by Oran Viriyincy.
The truth is that, outside of the New York urban area, there are probably no places in the United States where transit demand is high enough to require high-frequency bus service. That calls into question all transit agency plans to have lanes dedicated exclusively to bus-rapid transit. The better solution is that applied in Colorado, which built high-occupancy/toll (HOT) lanes between Denver and Boulder and runs a bus-rapid transit line called the Flatiron Flyer. Flyer buses have higher average speeds than any of the rail transit lines in the region, and construction of the HOT lanes significantly reduced congestion on the highway as they attracted autos away from the free lanes.
A few of the bus-rapid transit lines in the 2023 New Starts plan seem almost reasonable. Waco is proposing one that costs $1.4 million a mile; Flagstaff has one for $2.5 million a mile, and Austin is building one for $2.6 million a mile. Projects in Indianapolis, Memphis, and Monterey are under $10 million a mile.
At the other extreme is one in Fairfax County, Virginia, that is projected to cost $99 million a mile. This includes roadway widening, construction of new lanes, new sidewalks, and new bicycle facilities. Houston, Seattle, and St. Paul are planning or building lines that will cost more than $50 million a mile. Most of this will be completely wasted since the bus lanes will be empty more than 90 percent of the time.
In most situations, bus-rapid transit can work just fine using lanes shared with other vehicles. Buses will be faster than conventional buses because they will make fewer stops. If traffic is so bad that it delays buses, then steps should be taken to relieve congestion for everyone, not just the few people who ride transit.
Streetcars: 1880s Technology Today
Streetcars have been obsolete since 1927, when an Ohio company named Twin Coach introduced the first bus that was cheaper to buy and cheaper to operate than streetcars. This led hundreds of streetcar companies to replace their fleets with buses long before the so-called General Motors streetcar conspiracy (which began in 1937 and was an attempt by General Motors to capture some of the bus market from Twin Coach). The so-called modern streetcar revival began in the 2000s when streetcars were seen as a low-cost alternative to light rail.
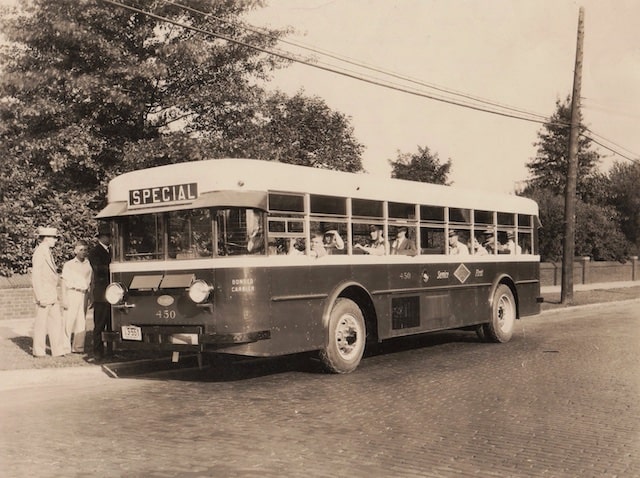
Introduced in 1927, the Twin Coach bus made streetcars obso- lete. Within a decade, 500 cities converted streetcars to buses. Photo courtesy of John Fageol.
Today, streetcars are much more expensive than most light-rail projects of the 1980s, which, as noted above, typically cost about $35 million a mile in today’s dollars. The 2023 plan considers only five streetcar projects, but their average cost is $93 million a mile. The one that is recommended for funding, in Kansas City, costs more than $100 million a mile. The least-expensive one is in Tampa, but even it is almost $60 million a mile.
For all this money, streetcars are actually negative transportation, causing far more congestion than they relieve. In Toronto, which has almost as many modern streetcars as every American city combined, streetcars are blamed for congestion because they are slow and can’t get out of their own way. Even many transit advocates think streetcars are dumb. Basically, there is nothing that a streetcar can do that buses can’t do better and for a lot less money.
Streetcar advocates claim that they generate economic development because they create a sense of permanence that buses can’t emulate. That’s a lie spread by the city of Portland when it built the nation’s first modern streetcar line in 2001. It gave developers along the line more than a billion dollars in subsidies to rejuvenate neighborhoods, and then told officials from other cities that all the redevelopment was due solely to the streetcar. No doubt Atlanta, Cincinnati, and other cities that bought the lie are disappointed today.
Light-Rail: 1930s Technology Today
Fundamentally, the sole difference between light rail and streetcars is a simple piece of technology: the coupler. Light-rail vehicles can be coupled together into two-, three-, or four-car trains, whereas streetcars don’t come equipped with couplers.
The first modern light-rail line opened in San Diego in 1981 at a cost of under $20 million a mile in today’s dollars. But the first true light-rail line began operating between Oakland and San Francisco in 1939 with the opening of the Bay Bridge. Part of the lower deck of the bridge was dedicated to streetcars, and the local streetcar company used long cars that bent in the middle for going around sharp corners and were often coupled together in trains of two or three cars. After the war, ridership declined and in 1948 the railcars stopped running on the lower deck, which was opened to automobiles.
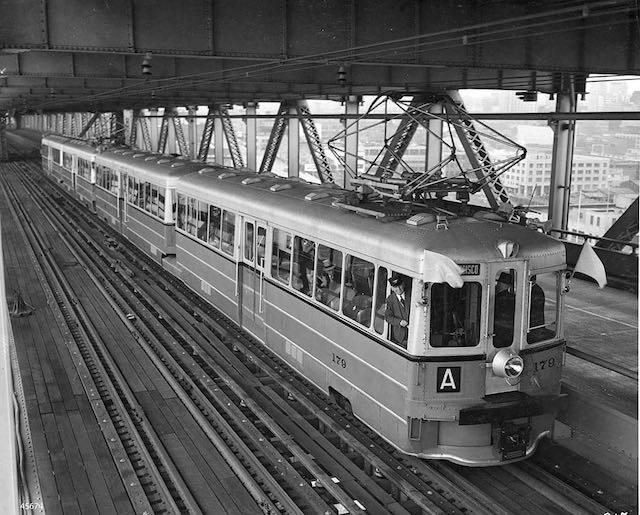
A two-car train crosses the San Francisco-Oakland Bay Bridge in 1939. Though the term light rail had not yet been coined, by today’s definition, this was the first true light-rail line. Photo courtesy of FoundSF.
In the 1970s and 1980s, Atlanta, San Francisco, and Washington were spending about $70 million a mile—about $140 million a mile in today’s money—building heavy-rail lines. Light-rail was billed as a low-cost alternative for smaller urban areas that would be able to attract almost as many riders as heavy rail without the expense of tunneling and elevated tracks.
Instead, light rail today has most of the disadvantages of streetcars—slow speeds, low capacities, and inflexibility—combined with costs that are much higher than heavy rail cost in the 1980s even after adjusting for inflation. Driving up the costs further, cities such as Seattle are attempting to build a light-rail system that runs almost entirely on its own right of way, thus combining the low capacities of light rail with the high cost of heavy rail.
Fifteen light-rail projects are included in the 2023 New Starts plan, nine of which are recommended for funding. These include the Boston Green Line extension to Medford, whose cost is currently expected to be $489 million a mile; Seattle’s line to Federal Way, which is expected to cost $405 million a mile; and a Los Angeles line to the San Fernando Valley, which is currently projected to cost $419 a mile. The San Fernando line is in the early planning stages and its final cost will probably be much more.
According to the plan, none of the light-rail projects in the 2023 plan will cost less than $138 million a mile. In addition, the costs of some of the lines have significantly increased since the plan was written. The lowest-cost one, Minneapolis’ Southwest line, is listed in the plan at $2.0 billion or $138 million a mile, but in fact the latest cost estimate has risen to $2.75 billion or $190 million a mile.
The next-least-expensive line is Maryland’s Purple Line, which according to the 2023 plan will cost $149 million a mile. But when the report was written, that line was projected to cost $2.4 billion, whereas the latest cost estimate is $3.9 billion or $240 million a mile. The third line costing under $200 million a mile was San Diego’s Mid-Coast route, which shouldn’t really be in the plan as it was completed and opened for business last November at a cost of $199 million a mile.
Light rail didn’t make sense when it cost $35 million a mile. Spending more than $200 million per mile is simply insane and a rip off of taxpayers.
Heavy Rail: Transit Overkill
If light-rail costs are insane, what to make of rail transit projects that cost a billion dollars per mile or more? The high cost of heavy rail has made it unpopular, and only nine projects are in the 2023 New Starts report. In fact, it is really only seven projects as three of them are phases 1, 2, and 3 of a subway line being built in Los Angeles. Four others are reconstructions or improvements to increase the capacity of existing lines.
The only two truly new lines in the plan are BART to San Jose and the next phase of New York’s Second Avenue subway. The Santa Clara Valley Transportation Authority, which is building the six-mile BART to San Jose line, says it will cost $6.9 billion, but the FTA itself is skeptical of that and pegs the price at $9.1 billion, or more than $1.5 billion a mile.
At almost $7.0 billion for 1.76 miles, the Second Avenue subway is even more expensive: nearly $4.0 billion a mile. On the other hand, this line is projected to carry more than 110,000 riders a day, which is more than the entire transit systems of all but ten urban areas. However, pretty much all ridership projections in the FTA’s 2023 plan are based on pre-pandemic data and assumptions.
Commuter Rail: Hardest Hit by the Pandemic
Commuter rail caters to high-income suburbanites who work in busy downtowns. As such, it was hardest hit by the pandemic. But transit agencies never let low ridership deter them from spending money on new transit lines.
A case in point is Orlando, which built a commuter-rail line that attracted so few riders that fares didn’t even cover the cost of the ticket machines. Despite this, it continued to expand that line. In 2019, fares covered just 7 percent of operating cost and as of January 2021, it was carrying less than 44 percent of 2019 riders. Yet the 2023 New Starts plan includes a proposal to extend the line to the Orlando airport.
At $200 million or $36 million a mile, this is the least expensive of the eight commuter-rail projects in the 2023 plan. Yet that doesn’t make it cost-effective.
Another project would spend $2.4 billion to increase the capacity of the Virginia Railway Express, which as of January was carrying less than 12 percent of its pre-pandemic riders. Similarly, the Bay Area’s Caltrain is spending nearly $2.0 billionelectrifying its trains, which is supposed to increase their capacity by 11 percent. That also seems pointless as the trains are currently carrying less than 17 percent of pre-pandemic riders. The hidden agenda behind Caltrain electrification is to provide power for California high-speed trains operating at conventional speeds until the state can find enough money to build a complete high-speed rail route.
The biggest commuter-rail projects in the 2023 plan are the $12.7 billion reconstruction of tunnels under the Hudson River for New Jersey Transit and Amtrak trains, along with $1.7 billion for a New Jersey bridge that also serves those trains. The Trump administration fought the finance plan for the Hudson tunnel project, which calls for the federal government to pay nearly half the cost outright and to provide loans for the other half that supposedly would be paid back by New Jersey and New York—but don’t count on it. The fact that New Jersey Transit commuter trains are currently carrying just one-third as many riders as in the pre-pandemic era didn’t dissuade Democrats from ramming these projects through as soon as Biden replaced Trump.
The Hudson River tunnel project was questionable before the pandemic, as justification for it partly depended on projections of a huge increase in the number of jobs in Manhattan. The after-effects of the pandemic make it much more likely that the number of people commuting to Manhattan each day will remain well below 2019 numbers.
Automated Guideway: The Inglewood Connector
One project in the 2023 plan doesn’t fit in any of the above categories. It is to build a 1.6-mile automated transit line to connect Inglewood, California with a commuter-train line to Los Angeles. The project, which didn’t receive a recommendation, would cost at least $1.15 billion or more than $700 million a mile. Since Los Angeles commuter trains are currently carrying only 20 percent of pre-pandemic riders, the city of Inglewood should shelve this proposal.
The Cost of Politicizing Transportation
Federal spending on urban transit was questionable before the pandemic. Now, with transit ridership trending at less than half of pre-pandemic levels, it is completely stupid. Yet no one in the FTA or transit agencies seem to be interested in changing course.
The real problem is that federal policy has been to support capital improvements when the most efficient form of transit—buses running on streets shared with other vehicles—doesn’t require much capital. The result is that agencies think up wasteful projects just to be eligible for federal funds, picking more-expensive technologies when less-expensive ones would do and building new infrastructure when existing infrastructure would do. This generates political support from the engineering and construction firms that design and build these projects, which leads Congress to fund them even more.
Unfortunately, the most important lesson that transit agencies learned from the pandemic is that they don’t have to actually carry any passengers to get continued subsidies from Congress. Thus, they have less interest in proposing projects that will attract new riders than in projects that will enhance their budgets.
Florida Republican Senator Marco Rubio believes the United States needs an industrial policy to compete with China (because industries like housing and high-speed rail are working so well in China). Semi-libertarian economist Tyler Cowan agrees that the government needs to play a bigger role in infrastructure than more traditional libertarians would support. But the transit experience demonstrates why politicians should not try to set transportation policy: they will end up funding obsolete transportation rather than the transportation that people actually use.


#/media/File:Metro_Liner_from_the_Surfliner.jpg)
Two hundred years ago, Henry Clay’s American System called for the federal government to lead the way on infrastructure. The government began funding canal construction.
Railroads. The correct 19th Century answer was railroads.
I would argue that the first light-rail system in the United States was what is now Boston’s Green Line. By 1910 it had a downtown subway, an elevated section, and reserved median tracks on major avenues. It also ran multi-car trains with up to three vehicles per train.
Some streetcar systems in Europe have used couplers on their cars for many decades. Or would that be called light rail? One practice was to have two-car trains with one powered car and one unpowered “trailer.”
A very good article. One minor correction, the transbay rail system crossing the Bay bridge from the east bay to San Francisco was shut down and replaced with buses in 1958 not 1948, see:
https://en.wikipedia.org/wiki/Key_System#Transbay_rail_lines
1948 when most streetcar lines in the east bay were converted to buses, but the transbay service was kept in use until 1958.
“Two hundred years ago, Henry Clay’s American System called for the federal government to lead the way on infrastructure. The government began funding canal construction.
Railroads. The correct 19th Century answer was railroads.”
Corresponds with Antiplanners Infrastructure principal which tickles the law of unintended consequences.
Investments in fixed infrastructure and static technologies on large scale are risky ventures. NO ONE can predict what technologies will emerge to compete against it if it’s time frame is sufficient worry or very long.
At almost $7.0 billion for 1.76 miles, the Second Avenue subway is even more expensive: nearly $4.0 billion a mile.
New Yorks 2nd Avenue subway has been on again, off again under construction since 1930’s. Japan’s shonan Monorail is completely suspended hanging monorail. Was built in the late 60’s, opened by 1971 so it’s construction time was a mere couple of years, NOT DECADES. At a distance of 4 miles; 8 stations and run time 14 minutes at 45 mph. The number of passengers was 11 million a year in 2018 or 30,000 people a day.
A tougher, firmer longer monorail running thru 2nd, 3rd and other NYC Avenues would cost LESS than 2nd ave subway put together. Each train could Move tens thousands people a day per line and NO underground construction. 2nd Avenue is 8.5 miles long. So a twin monorail in Opposing directions could move 60-120k people per day; maybe more with longer trains.
The columns and beams can be stylized to any architectural style you want, be it classical, minimalist, art deco, The Tokyo-Haneda Monorail has been operating since 1964. This eight-mile dual-beam system is privately owned and TURNS A PROFIT each year.
So parallel monorails on 3-4 Avenues; could carry 350-500 thousand daily riders. In total, despite being called subway, 40% of NYC’s track is above ground. Metropolitan Transportation Authority has blamed increasing subway delays on overcrowding, an explanation that boggles the curiosity…the city’s subway system carried far more riders during and after World War II and didn’t suffer similar delays. It is also good for low effect on other transport modes such as pedestrians, animals, and road traffic. The real estate right of way costs are comparatively low if done economically it would be more like a small power line utility easement than a road right of way. Built in Middle of avenues; The aerodynamics, speed and electric propulsion are all applicable…
– Derailment is virtually Impossilbe.
– Being elevated, accidents with surface traffic and pedestrians are impossible
– Quick construction times: Las Vegas monorail was built in 7 months.
– Building heavy rail in the city means rerouting cables/lines and pipes, digging up infrastructure. Monorail beamway is installed modularly.
– Being electrically driven by a power provided from the rail, monorails don’t require the spider web of above ground power lines like trams and lightrail. And don’t pollute
– Monorails are impressively quiet.
Unlike subways; Monorails “Dont flood” because it’s not tunneled. On any given day, NYC has to pump 13 Million gallons of water a day out of the subways.
New York has a completely different culture than Japan. In an ideal world, a monorail or some other elevated train might make sense on the East Side of Manhattan or maybe elsewhere. However, the city has had a century and a half of experience with the old-style steel viaducts and people have an almost visceral dislike of any elevated system passing by their windows. It doesn’t matter what the structure looks like or how quiet the trains are; I’m sure the majority of Manhattan residents would oppose it and the MTA wouldn’t dare propose such a thing. The only reason the Port Authority got away with the JFK AirTrain is because the structure was built in the median of an expressway.