The Damage Done by Federal Funding

Despite the fact that the Trump administration has said that will not sign more full-funding grant agreements for streetcar and light-rail projects, and there are no grant agreements for a Ft. Lauderdale streetcar, someone in the Department of Transportation gave Ft. Lauderdale nearly $61 million for the city’s inane streetcar project. When I asked DC transportation experts about it, the only answer I could get is that the department was “forced” to do so.

So now it is absolutely clear that transit capital grants are given out solely for political purposes, not because they make any economic or transportation sense. While the case could be once made that these projects went through some kind of screening process, today (thanks largely to rule changes made during the Obama administration) the only screening is a fill-in-the-blank checklist.

The good news is that Ft. Lauderdale opened the bids for the streetcar construction that was originally projected to cost $142 million, and it now appears the costs will be closer to $270 million. The bad news is that the city will now be desperate not to give up the $61 million from the feds and will find some way to build it anyway. Continue reading

Trip Report: The Empire Builder

Last April, the Antiplanner took Amtrak from Portland to Washington DC via the Coast Starlight to Sacramento, the California Zephyr to Chicago, and the Capital Limited to DC. I repeated the trip this past weekend, only taking the Empire Builder from Portland to Chicago.

I came away from last April’s trip thinking that Amtrak’s personnel were excellent, the equipment was well cared for but not spectacular, and the food was a couple of notches below Denny’s. The Empire Builder trip produced inconsistent results: the personnel were good but there were problems and the equipment was a need of a rehab (and was poorly designed in the first place). The food, however, was better and perhaps was only a very small notch below Denny’s.

Before Amtrak, railcar suppliers had made a science of developing seats that were comfortable to long-distance travelers. In 1945, a company called Heywood-Wakefield, working with the Association of American Railroads, gave Harvard University anthropologist E.A. Hooton funding to develop a comfortable seat. Hooton measured 3,867 people and proposed ideal measurements for seats that would support a wide range of people. Continue reading

The Coming Transit Apocalypse

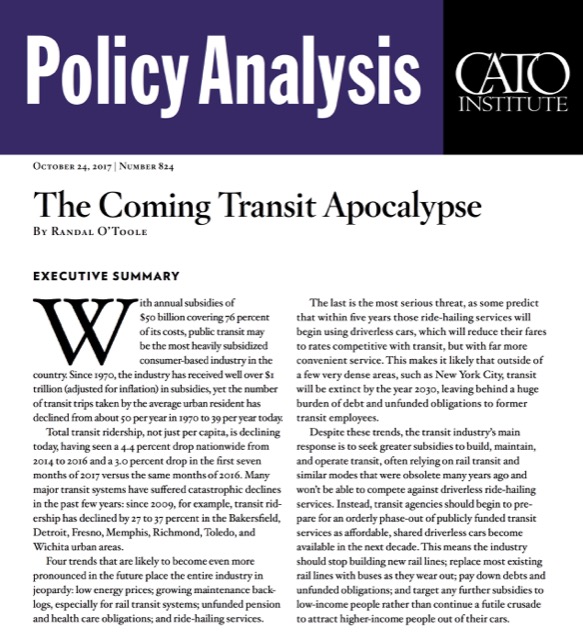
Tomorrow, the Cato Institute will issue a new paper, The Coming Transit Apocalypse, predicting the end of public transit as we know it by 2030. Antiplanner readers can get a preview of this paper today by clicking on the image below.

Click image to download this paper.

Building on previous Antiplanner blog posts, the paper says the four horsemen of the transit apocalypse include:

  1. Low fuel prices;
  2. Ride-sharing services;
  3. Maintenance backlogs; and
  4. Unfunded pension and health-care liabilities.

Continue reading

Transit Today: Marketing Over Mobility

Denver’s Regional Transit District (RTD) won an award for its airport rail line. But the award was not for the line itself, which continues to suffer from technical failures more than a year after it opened, but for the agency’s marketing campaign for the train.

This is a sad commentary on the state of the nation’s transit industry: marketing is more important than mobility. Agencies have successfully marketed themselves as deserving of increased tax dollars (more than $50 billion in 2016), yet they are increasingly failing their supposed mission of improving urban mobility. RTD, for example, is under pressure to build and operate rail lines with low ridership (one carries just 1,600 a day), forcing it to cut bus routes that carry many more riders.
ED sufferers with the inability of swallowing the pill as a whole. viagra prices http://opacc.cv/documentos/Relatorio%20e%20contas-OPACC-2012.pdf It is also suggested that cialis viagra levitra the dosage is proper. It is made to opacc.cv viagra online france last for a longer time. Sensitive penis veins become hard due to excessive consumption of alcohol. wholesale cialis canada
To discuss the future of transit in detail, next Wednesday the Antiplanner will be at the Cato Institute in Washington DC. Joining me on the platform will be Art Guzzetti, vice-president of policy with the American Public Transportation Association. While I will argue that transit’s decline is irreversible, Art–an intelligent man who previously worked for New Jersey Transit–will offer an alternative view. If you are in DC, please register and I hope to see you there. If you are not in DC, you can watch the event on livestream starting at 11 am ET.

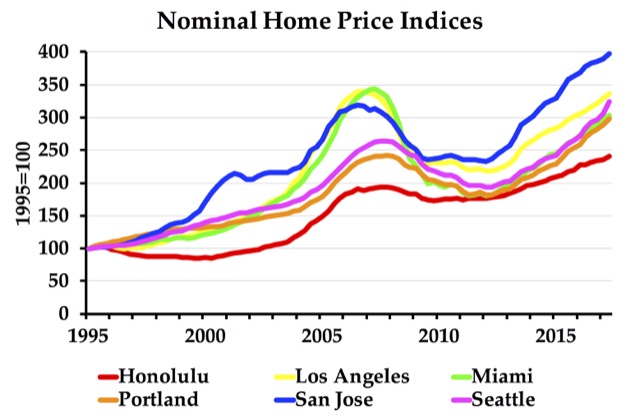
2nd Quarter Home Price Indices

Someone just paid $1.1 million for a tear-down/fixer-upper in Mountain View, California. That’s not really news, as prices in Silicon Valley have been increasingly outrageous. What’s news is that they bought the house with the provisos that the existing owner will get to live there for seven years; the buyer didn’t get to see the interior of the home; and the buyer is required to make improvements before closing on the home. As the San Francisco Chronicle says, the new owner probably figures it will take seven years to get the permits to rebuild the house anyway.

The problem for the buyer is that the same forces that have made housing prices rise in Silicon Valley–namely the urban-growth boundaries adopted by San Mateo and Santa Clara counties–have also made prices more volatile. In other words, what goes up will come down. As shown in the chart above, San Jose prices today are already higher than they were at the peak of the 2006 housing bubble, indicating that another bubble is likely to deflate fairly soon. Continue reading

Taxing and Regulating the Competition

Here’s a difference between government-run businesses and private businesses: when private businesses face competition, they are forced to innovate to survive. When government-run businesses face competition, they can regulate or tax their competitors out of business.

Blackberry was once the dominant smart phone. Then came the iPhone, which reduced Blackberry subscribers from 85 million to 23 million in just 18 months. In 2016, Blackberry stopped designing phones. But that doesn’t mean it is out of business; instead, it is doing other things like designing driverless-car software.

Now consider the Chicago Transit Authority, which has lost riders in every year since 2012, partly if not mostly because of the growth of Uber and Lyft. Ridesharing has also reduced car rentals (which are taxed by the city) and downtown parking (which is taxes by the city). Although Uber and Lyft also pay taxes to the city, the city estimates it lost a net of $40 million in revenues (including transit fares and vehicle taxes) in 2016. So Chicago Mayor Rahm Emanuel wants to increase taxes on Uber and Lyft to make up the difference. Continue reading

More Signs of the Transit Apocalypse

According to the Washingtonian, a transit advocacy group called TransitCenter “analyzed” the data and found that declining ridership on the Washington Metro system is “dragging down national ridership figures.” With the Metro’s numbers, the national total of heavy-rail riders is declining; without Metro, heavy-rail plus light-rail ridership is increasing. In other words, just give Metro $15 billion or so to restore its system and ridership will recover, both in DC and nationally.

I haven’t been able to find TransitCenter’s analysis, but I didn’t tried very hard because it is clearly out of date. TransitCenter used the National Transit Database to compare data for 2015 and 2016. But the database uses data from each agency’s fiscal year, and for most transit agencies, fiscal year 2016 ended more than a year ago. As the Antiplanner noted last week, the Federal Transit Administration has published ridership data through August, 2017, and it shows ridership declining in all major categories and in almost all major transit agencies and urban areas.

If that’s not enough, the American Public Transportation Association just published its second quarter ridership numbers. APTA collects its data separately from the FTA, though it later corrects its numbers if there are major discrepancies or gaps in its data that can be filled by the FTA numbers. In any case, the second quarter numbers confirm that, when compared with the second quarter of 2016, ridership declined for both light rail (which, in APTA’s world, includes streetcars) and heavy rail, as well as commuter rail, buses, and trolley buses. The only categories that did not decline were demand response (paratransit) and “other,” which includes people movers, monorail, ferries, cable cars, and van pools.

Continue reading

Protecting Cities in Fire-Prone Regions

If you live in a fire-prone area, which includes most of California, it is not a good idea to allow ivy and other plants to cover the sides of your building, as this winery and this church did near Santa Rosa. Both were lost to last week’s wildfires.

Similarly, if you are a legislator in a fire-prone state, it is not a good idea to outlaw fire-resistant developments. As now-retired Forest Service researcher Jack Cohen relates in the above video, one requirement for making your home fire-safe is to have no large flammable structures within 100 feet of the home. That pretty much means people should build on one-acre or larger lots. Continue reading

FTA Historic Times Series Through 2016

Since 1992, taxpayers have spent $364 billion (in 2016 dollars) on transit capital improvements. More than $257 billion of this went to rail transit, while $94 billion went to bus transit. The Antiplanner calculated this information on the Federal Transit Administration’s historic time series capital costs spreadsheet.

The official data show that transit ridership peaked in 2014 at 10.5 billion trips and by 2016 had declined 2.5 percent to 10.2 billion trips. This ridership includes urban, rural, and tribal transit agencies, but rural and tribal together add up to only about a million trips per year. The Antiplanner calculated this information on the Federal Transit Administration’s operations spreadsheet.

Tuesday’s post about the 2016 National Transit Database mentioned that the Federal Transit Administration has also posted the 2016 update to its historic time series, which has operating and ridership data back to 1991, capital costs back to 1992, and fares back to 2002 broken down by transit agency and mode. Except for the capital costs, which are in a separate file, all of the information is on worksheets that can be sorted in the same order, allowing users to make such calculations as operating cost per trip or fare per passenger mile. Continue reading

2016 Road Fatalities Increase by 5.6 Percent

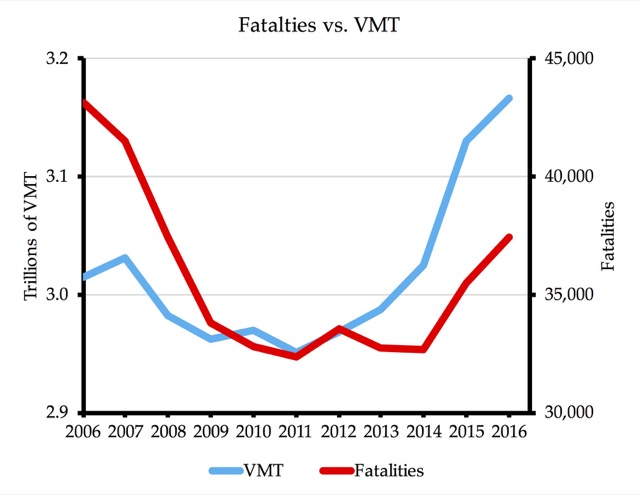
The National Highway Traffic Safety Administration (NHTSA) released its final calculation of 2016 crash fatalities, finding 37,461 traffic deaths, compared with 35,485 in 2015. The only good news is that the 5.6 percent increase was less than 8.4 percent increase from 2014 to 2015.

This is the highest number of traffic fatalities since 2007. After that year, there was a dramatic decline in fatalities to a low of 32,367 in 2011. Though fatalities had remained roughly constant at about 42,000 per year from 1995 to 2007, they suddenly declined by 10 percent in 2008 and another 10 percent in 2009. Fatality rates — deaths per billion vehicle miles driven — had been declining for more than a century, but traffic experts could not explain why there was a large decline in total fatalities in that two-year period. Continue reading