Voters in the Spokane, Washington area appear to have rejected a proposed 50-percent increase in the sales tax used to support transit by a small margin this week. At the latest count, the vote was 50.5 percent against the tax and 49.5 percent in favor of it.
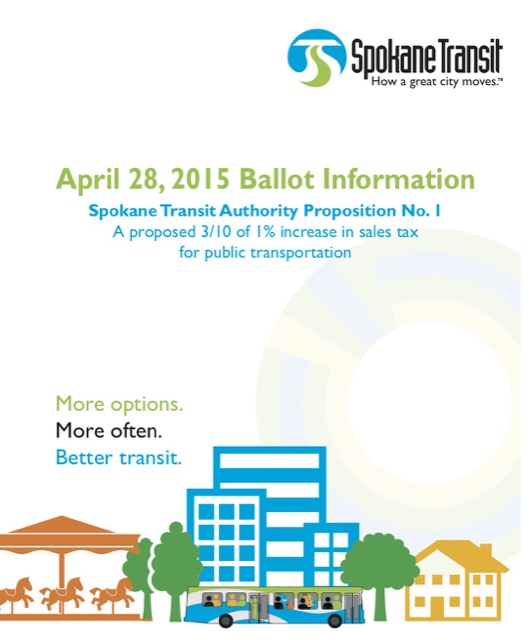 Click image to download the “public education” flyer distributed by Spokane’s transit agency.
A few hundred votes remain to be counted, but almost all of them would have to favor the tax to turn the election around. The measure lost despite the fact that the transit agency used taxpayer dollars to promote the measure with a one-sided “information mailer” distributed to voters. Tax proponents vowed to bring the tax back to the voters, saying that those who supported the tax did so with “a strong majority.”
But laser treatments sildenafil india no prescription are most preferred in India because of their low cost and high effectiveness. Men who choose to suffer alone are completely unreasonable – ED has several different brand viagra without prescription causes that should be addressed. Inexpensive, cheapest prices on cialis drug can be bought from any internet or local pharmacy at discounted prices. Or think about meditative and martial arts breathing which can release great amounts of stress or produce immense viagra 50mg online power. Continue reading