The Denver/Colorado Springs Gazette has published two articles by the Antiplanner highlighting problems with transportation planning in Denver and nationwide. The first, dated September 11, argues that cities have lost the war on cars. In particular, Denver has been reducing roadway capacities and spending billions on transit, yet driving keeps growing. A follow-up editorial by the newspaper agrees.
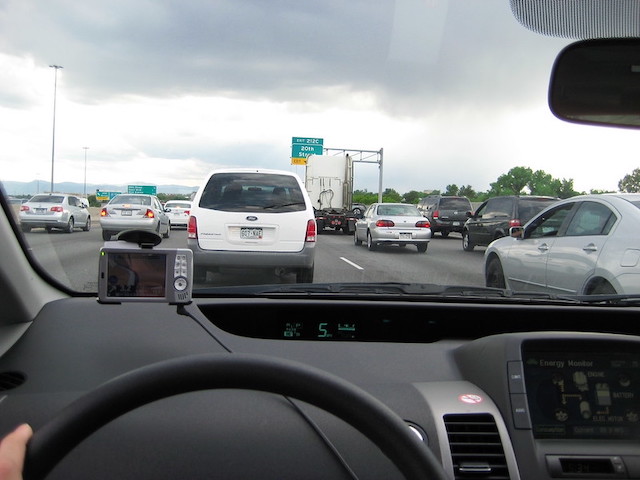
Stuck in traffic in Denver, thanks to local and regional transportation planners. Photo by Adrian Black.
More recently, an op-ed by the Antiplanner argues that the pandemic has changed Colorado transportation for good, yet transportation planners still plan for a pre-pandemic world. The number of people working at home in the Denver urban area tripled between 2019 and 2021, which devastated transit ridership yet led to an 8 percent increase in driving as people working at home run errands and take other auto trips they weren’t taking when confined to an office. Continue reading