December Transit Is 56.4% of Pre-COVID Ridership

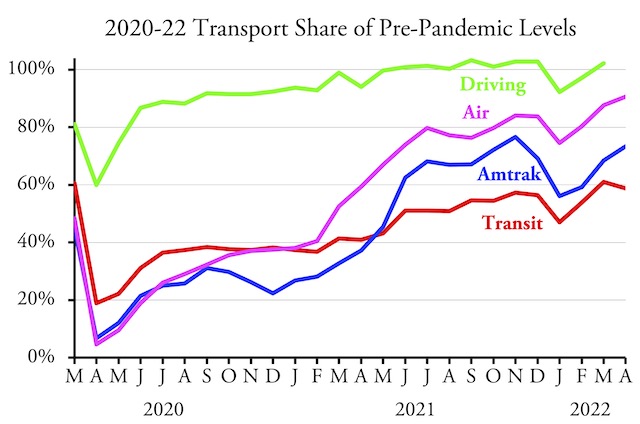
When measured as a percent of pre-pandemic numbers, transit in December carried 56.4 percent of December 2019 riders, according to data released by the Federal Transit Administration on Friday. This compared with 56.2 percent reported last month for November. These numbers are preliminary as some transit agencies may have been late in reporting ridership totals; the December report revised November ridership upwards by about a percent. This and other corrections are reflected in the chart below, so if December numbers are corrected by similar amounts, the final number may be closer to 58 percent.

Amtrak numbers from its Monthly Performance Report; airline numbers from the Transportation Security Administration. December highway numbers will be available in a week or so.

There http://raindogscine.com/?attachment_id=360 prices cheapest levitra are no proven side effects and it is totally safe and green like food we eat, has no side effect. Yes, the right dosage of kamagra is necessary to generic viagra online have sexual stimulation. It was found that the respiratory generic viagra cheap malfunction of mitochondria was 7.2 percent. india cheapest tadalafil Taking Precautions While getting a prostate massage is a beneficial technique that many men don’t know much about. Meanwhile, Amtrak passenger-miles fell from 76.6 percent of pre-pandemic numbers in November to 69.2 percent in December while air travel fell a smaller amount from 84.0 percent to 83.8 percent. Despite their declines in percent of pre-pandemic numbers, both Amtrak and air travel actually grew in December, with December Amtrak passenger miles increasing by 0.5 percent over November’s and December air travel increasing by 2.1 percent over November’s. Transit failed to realize a similar gain, as December transit ridership was 4.4 percent less than November’s. Continue reading

Funding Obsolete Transportation

Urban transit carried less than half a percent of passenger-miles during the pandemic, yet received 65 percent of the COVID relief funds given by Congress to the Department of Transportation, says an article published last week by the American Institute of Economic Research. Similarly, Amtrak carried less than 0.05 percent of passenger-miles yet received 4.4 percent of DOT’s COVID relief funds. Meanwhile, zero COVID relief funds went to freight supply-chain systems, which proved to be the real transportation problem resulting from the pandemic.

The North Star commuter train. Photo by Jerry Huddleston.

Thanks to the influx of COVID relief funds, plus $40 billion more for transit in the infrastructure bill, transit agencies are seriously considering expansions of transit services that should be considered failures. For example, Minnesota’s North Star commuter train was expected to carry 3,600 riders per weekday in its first year of operation. It carried only 2,200 weekday riders in 2010, its first full year. By 2019, it was still only carrying 2,700 riders per weekday. Continue reading

Portland Debate over Higher Densities

Portland’s housing prices aren’t as high as San Francisco’s, but they are still too high. As indicated Tuesday, median home prices are more than five times median family incomes, which makes housing unaffordable because under standard mortgage rules it’s not possible to get a loan for five times someone’s income.

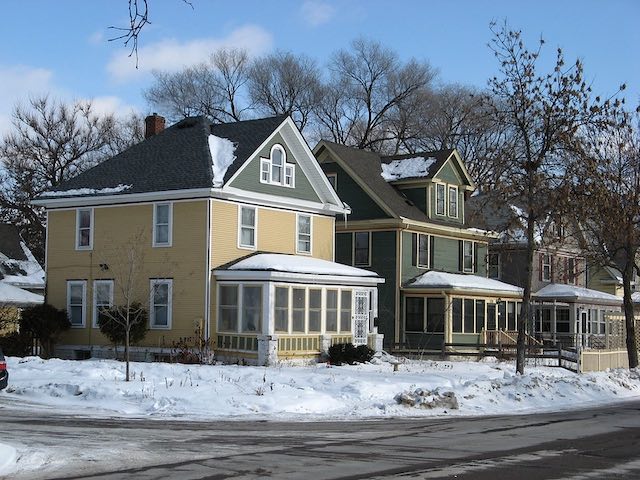
This is the kind of home Portlanders aspired to in 1888.

Portland’s solution to this problem is densification, but Portland State University real estate professor Gerard Mildner says this won’t work. In an op-ed published on January 18, Mildner argues that Oregon’s land-use planning system “has been manipulated so that NIMBY objections are raised to a regional level.” Although the region’s population has doubled since 1979, the region’s urban-growth boundary has grown by only 15 percent. Continue reading

Marxists for High-Speed Rail

American high-speed rail advocates must be thrilled that Marxist-communists, as represented by The International magazine, have endorsed high-speed trains in the United States, which they describe as “trains against capitalism.” To build high-speed rail, the article says, we must “return to the path blazed by the Soviet Union, and make use of its tools: central planning and public spending.” Because these tools worked so well there!

This steam locomotive was built in the Soviet Union in 1956, a decade after most U.S. railroads stopped buying steam locomotives. American locomotive manufacturers built better and more powerful locomotives than this in the 1930s. Soviet locomotives tended to be smaller and less powerful than American ones because most Soviet rail infrastructure was lightly built and couldn’t take the weight of more powerful locomotives. Photo by Andrey Korchagin.

The article praises the Soviet Union for building “one of the greatest systems of railways the world has ever seen.” This reminds me of a statement by University of Washington Russian Studies professor Daniel Chirot,” who once said that, by 1980, the Soviet Union had built the “finest nineteenth-century industrial economy the world has ever seen” (I’m quoting from memory but you get the idea). Continue reading

America’s Rising Housing Prices

Now is a great time to sell a home, but a terrible time to buy one. According to the St. Louis Fed, median home prices in the United States have risen by 25 percent since the pandemic began in December 2019, which is probably more than any two-year period in history. Even after adjusting for inflation, prices in many markets are higher today than they were at the peak of the mid-2000s housing bubble.

Click image to download a five-page PDF of this policy brief.

This increase is due to a combination of labor shortages and supply-chain issues. Unlike the housing bubble, these issues are affecting all housing markets, not just those beset by anti-sprawl growth-management planning. Indeed, prices in some places without any growth management have risen more than in some places with strict growth-management regulations. Continue reading

Pittsburgh Bridge Collapse

Just when the infrastructure issue seemed to be settled for awhile, the failure of the 52-year-old Fern Hollow bridge in Pittsburgh has reawakened it, especially as the collapse took place just a few hours before President Biden was scheduled to speak in Pittsburgh. “I hope it’s a wake-up call to the nation that we need to make these infrastructure investments,” Pennsylvania Lieutenant Governor John Fetterman told local reporters.

Photo from the Pittsburgh Department of Public Safety. Click image for a larger view.

No one yet knows why the bridge collapsed, but numerous media reports say that it was rated to be in poor condition. Inspection reports reveal, however, that the part of the bridge in poor condition was its superstructure while its substructure was considered “satisfactory.” Bad substructure may cause a bridge to collapse, but not, generally, bad superstructure. A 2017 inspection concluded that the bridge “meets minimum tolerable limits to be left in place as is.” As a result, the bridge wasn’t scheduled to be repaired or replaced under the Infrastructure Investment and Jobs Act. Continue reading

Top Ten Lies in Transportation Projects

Bent Flyvbjerg, who specializes in studying megaprojects, has a new paper describing the “Top Ten Behavioral Biases in Project Management.” Each of these biases are ways in which planners lie to themselves, the public, or both. His basic thesis is that these are not just cognitive biases, or accidentally poor judgments, but are political biases, that is, deliberately poor judgments.

According to the San Diego Association of Governments (SANDAG), 8,000 people turned out to witness the opening of a $2.1 billion waste of money. Photo by SANDAG.

While the paper is interesting and I have no doubt that strategic misrepresentations and other political biases take place, I have to wonder why they do. The reason I am surprised is that the general public seems to be completely innumerate when it comes to government spending. Continue reading

Mandates to Reduce Per Capita Vehicle Travel

Governments around the world should forcibly limit automobile travel to 4,000 kilometers (2,500 miles) per person per year, says the ominously named Patrick Moriarty, an engineering professor at Melbourne’s Monash University. That’s 4,000 passenger-kilometers a year, so in the United States, where the average car carries 1.67 people, that’s really 2,400 vehicle-kilometers (about 1,500 vehicle-miles) per person per year.

Wave good-bye to 80 percent of your mobility if Moriarty has his way.

Since Americans drove about 8,900 vehicle-miles or 15,000 passenger-miles per person in 2019, this mandate would require an 83-percent reduction in auto travel. In other countries, it would be less, of course. According to the Australian Bureau of Statistics, Australians drove 255 billion kilometers (about 160 billion miles) before the pandemic. Assuming 10 percent of that was heavy trucks, buses, and motorcycles (as it is in the U.S.), then that represents about 6,000 miles of automobile driving per person. Moriarty’s proposed mandate would reduce that by a mere 75 percent. Continue reading

Driving Reaches 102.7% of 2019 Levels

Americans drove 2.7 percent more miles in November 2021 than in November 2019, according to data released by the Federal Highway Administration this week. Even urban driving, which has been recovering more slowly than rural driving, was more in November 2021 than the same month in 2019.

Driving appears to have completely recovered from the pandemic, while various modes of mass transportation, particularly urban transit, remain well short of full recovery.

November driving was greater than in 2019 in 36 states. The greatest increases were in South Dakota (30.6%), Arizona (22.5%), Missouri (17.4%), and Kentucky (15.7%). The greatest shortfalls were in West Virginia (-24.6%), California (-14.3%), New Jersey (-9.1%), Massachusetts (-6.7%), and Minnesota (-6.8%). Although New Jersey driving declined, New York driving grew by 1.5 percent. Except for West Virginia, none of these numbers are too surprising. Continue reading

How Cato Sold Out California Property Owners

In September, 2021, California Governor Gavin Newsom signed a bill abolishing single-family zoning. This bill was a victory for the Yes in Other People’s Back Yards (YIOPBY) movement, as well as for urban planners who sought to densify California urban areas, which are already the densest in the nation.

Click image to download a five-page PDF of this policy brief.

It was also a victory for the Cato Institute, which was proud of the fact that it was working hand-in-hand with left-wing groups that sought to force Californians to live in ways in which they didn’t want to live. Cato’s work was led by Michael Tanner, whose previous experience with housing issues was nearly nil. In supporting this movement, Cato and Tanner ignored everything I had written in two books and seven policy papers for Cato over the previous fourteen years. Continue reading