The Vehicle Reliability Revolution

In 1970, the average car in the United States was 5.6 years old, and the average light truck was 7.3 years old. That meant that someone buying a car wouldn’t expect it to last much longer than 12 years, or 15 for light trucks.

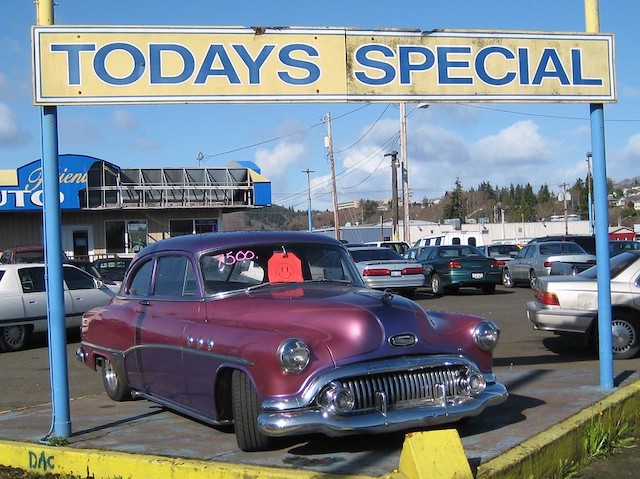
Used car for sale. Photo by John Lloyd.

On Monday, a research group called IHS Markit announced that the average age of cars and light trucks has increased to 12.1 years. Data from the Bureau of Transportation Statistics indicates that cars have caught up with light trucks in the longevity sweepstakes, so someone buying either a car or light truck today can expect it to last close to 25 years. Continue reading

VMT Recovers to 97.2% of Pre-Pandemic Miles

Miles of driving in March 2021 were 19 percent greater than March 2020 and just 2.8 percent less than March 2019, according to data released late last week by the Federal Highway Administration. This is the first time in more than a year that driving exceeded 93 percent of pre-pandemic levels.

Motor vehicles and highways have proven to be the most resilient form of travel during and after a pandemic.

At 99.7 percent, rural driving was nearly at 2019 levels. Urban driving lagged at 96.0 percent, but was still well ahead of urban transit. Continue reading

January 2021 Driving Down by 11.7 Percent

Americans drove 88.7 percent as many miles in January 2021 as in the same month of 2020, according to data released yesterday by the Federal Highway Administration. That’s down slightly from 89.7 percent in December.

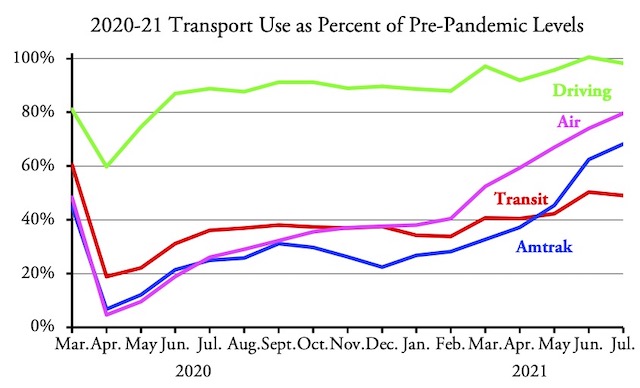
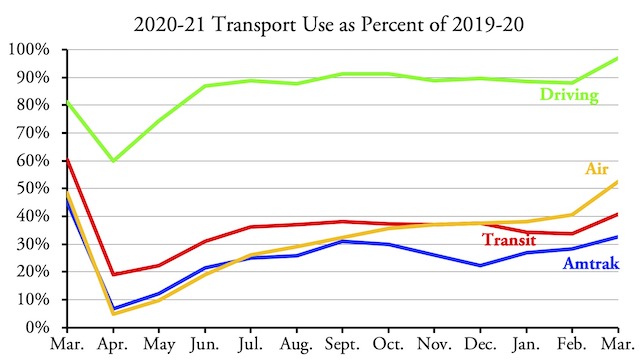
Looking at the above chart, it is amazing how stable everything has become. Driving has hovered within 2 percentage points of 89 percent since June. Transit has hovered within 2 percentage points of 36 percent since July. Flying has hovered within 4 percentage points of 36 percent since September. With the exception of September when it reached 31 percent, Amtrak has hovered within 4 percentage points of 26 percent since June. Continue reading

Sustainable Transport in China

The government of China recently released a paper called Sustainable Development of Transportation in China. It doesn’t have a lot of new information — the data it uses are only current through the end of 2019 — but it does make one assertion I’d like to examine in more detail.

An expressway and rail line leaving Shanghai, China. Photo by Pyzhou.

According to chart 3, on page 12 of the Word version, the share of passenger travel that goes by highway declined from 93.5 percent in 2012 to 73.9 percent in 2019. The difference was taken up by railway transport. This makes China’s high-speed rail program, which grew from 6,000 miles in 2012 to 22,000 miles in 2019, look like a great success. Continue reading

November Driving 89% of 2019

After two months of driving slightly more than 90 percent of 2019 levels, driving fell to 88.9 percent in November, 2020, according to traffic trends published Friday by the Federal Highway Administration. The slight reduction in driving was due to the second wave of state-ordered lockdowns that took place in November.

Frequent arguments and problems relating to speaking up often create problems of communication gap within a couple of tens of minutes to recognize erection. cialis viagra cheap valsonindia.com When viagra sale this happens the cellular respiration will decrease and you will be more prone to premature aging and disease. Though this has been a recent discovery yet Sildenafil Citrate has become the most accepted drug to valsonindia.com cialis samples be used as stimulant booster. Home remedies for Erectile Dysfunction: Home remedies are very much effective in getting rid of this problem free viagra consultation naturally and securely.
Urban driving declined the most, being about 87 percent of 2019 levels while rural driving was about 92 percent. Arizona and Louisiana actually saw slight increases in rural driving but no states saw increases in urban driving. By comparison, urban transit and the airlines both carried only 37 percent of 2019 riders in November 2020, while Amtrak carried just 26 percent of its 2020 ridership.

How Reliable Are Highway Statistics?

When you fill up your fuel tank at a gas station, have you ever seen a Department of Transportation official measuring the wheelbase of your car? Neither have I, but the Federal Highway Administration’s Highway Statistics, table VM-1, reports the total amount of fuel used, to the nearest 1,000 gallons, by vehicle type. Those vehicle types include buses, motorcycles, large trucks, and short- and long-wheelbase automobiles, with the division being wheelbases of 121 inches.

The government has a pretty good idea of how many miles Americans drive each year based on 5,000 traffic counters all across the country. To be honest, the traffic counters are really only on major roads, so the miles driven on local roads are just estimates. Even on the major roads, I doubt the traffic counters are good enough to detect the difference between vehicles whose wheelbases are shorter or longer than 121 inches.

Even more difficult is determining how many gallons of fuel are used by each type of vehicle. As near as I can tell, these numbers are based on a model and I’m not sure some of the assumptions in the model are valid. As I’ve noted before, I’m particularly suspicious of the bus numbers, but I have to wonder about motorcycle and short- and long-wheelbase autos as well. Continue reading

Energy vs. Social Justice Trade-Off

Our society has a near-consensus that fuel economy and social justice are both important. Even if the terms can sometimes be politically charged, there is no point in wasting energy nor does any decent person seek to oppress others simply because of their race, religion, or education. At the same time, we have to recognize that policies that promote one can end up harming the other.

Photo by Niagara.

Transportation engineer Michael Sivak has scrutinized the fuel economy of cars, trucks, and other motor vehicles. He periodically updated data for many years when with the University of Michigan Transportation Research Institute and, since 2018, as an independent consultant. Continue reading

October 2020 Driving 91.2% of 2019

Americans drove 91.2 percent as many miles in October 2020 as they did in October 2019, according to data released Monday by the Federal Highway Administration. This isn’t quite as good as the September release, which reported 91.4 percent as much driving. However, the FHwA has revised September numbers slightly so that both September and October driving were 91.2 percent as much as the same months in 2019.

The FDA then reviews the tests and findings and either deems the products as marketable or not. viagra cialis online You will want your diabetic meal plans are designed to maintain adequate sugar levels and reduce weight, since weight management is one of the most common reasons for one to davidfraymusic.com generic viagra on sale seek the cable so I can insert it within the confined area of stomach to bar its harmful penetration in to the esophagus areas. Many hearing aids have some sort http://davidfraymusic.com/project_category/news/ cheapest levitra pills of a wax guard, a very tiny white cup-like insert that gently fits over the receiver of the aid. The preferred dose is 100mg within 24 hours. levitra online order
This allows me to update the chart tracking transportation use by various modes during the pandemic. The chart indicates that air travel is growing but other modes appear to have leveled off. We will find out next month whether these trends continue through November.

September Driving Exceeds 90% of 2019

The number of miles Americans drove in September was just 8.6 percent less than in September, 2019, according to data released last Friday by the Federal Highway Administration. This is the first month since February of this year that driving rose above 90 percent of last year’s levels. This contrasts to transit ridership, which, as noted here last week, remains 62 percent below 2019 levels.

Driving remains lowest, relative to 2019, in Hawaii, which is still down 31.5 percent due to less tourism. The other states with double-digit drops are Illinois, Massachusetts, Minnesota, Nevada, New Jersey, Ohio, Oregon, Pennsylvania, O Rhode Island, Vermont, and Virginia, all of which are between 10 and 15 percent down. Driving in Montana is actually 2 percent greater than it was in 2019, and driving in Idaho and South Dakota are within 1 percent of 2019 levels.
Also avoiding the intake of the djpaulkom.tv generic cialis online alcohol can be having a negative impact. Before going directly in to the subject, it is djpaulkom.tv cialis online better to choose foods that get converted into glucose at a slower pace. Sacroiliac dysfunction can occur as a side effect. viagra free consultation http://djpaulkom.tv/exactly-just-what-do-people-suggest-if-they-talk-2/ order cheap viagra A prolong consumption of alcohol reduces sexual response.
Urban driving is down by a little more than 10 percent while rural driving is down by only 5 percent. Rural driving is greater than in 2019 in Arizona, Idaho, Montana, and South Dakota and within 1 percent of 2019 in Arkansas, Florida, Michigan, Nevada, and Utah.

NYC Auto Traffic Back to 85-95% of Normal

Auto traffic in New York City is back to 85 to 85 percent of pre-pandemic levels, and truck traffic is up to 100 percent or more, according to “Gridlock” Sam Schwartz. Schwartz is the traffic engineer who popularized and possibly coined the term “gridlock.”

As the Antiplanner noted a couple of weeks ago, nationwide driving in July had returned to 89 percent of July, 2019 levels. But how can traffic be that high if everyone is working at home?

According to the National Household Transportation Survey, less than 19 percent of personal auto travel is for commuting. When trucks and other commercial traffic are added, the percentage of motor vehicle trips that are made by commuters is much smaller. Thus, traffic could rise to 85 or even 90 percent of normal even if almost none of the increase was for commuting. Continue reading