Purple Congestion Eater–or Congestion Maker?

Residents of Montgomery County, Maryland, are skeptical of a proposed light-rail line known as the “purple line” (to distinguish it from the DC area’s Red, Orange, Blue, Yellow, and Green heavy-rail lines). AAppropriately so: The Antiplanner has reviewed the draft environmental impact statement (DEIS) and found it to be biased and misleading.

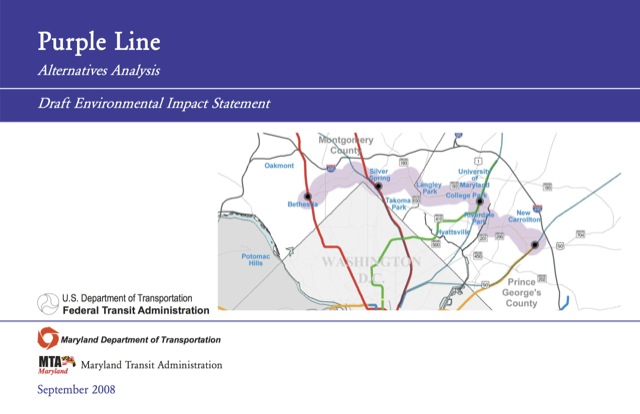
Click on image to download entire, 37-MB DEIS. Click on the link in the above paragraph to go to the DEIS web page where you can download selected chapters.

The DEIS considers seven alternatives to doing nothing: one called “transportation system management” (TSM), which is basically improving bus service without significant new infrastructure; low-, medium-, and high-cost bus-rapid transit; and low-, medium-, and high-cost light rail. (Planners call these “low-, medium-, and high-investment alternatives, but it is only an investment if you get a return.) For a route of about 16 miles, the capital costs range from $5 million per mile for TSM to $92 million per mile for high-investment rail.

Continue reading

Congestion King

The Texas Transportation Institute has released its annual urban mobility report, and Washington, DC once again takes the crown of wasting the most time and fuel per commuter. Though the urban mobility report makes some questionable claims about the congestion relief provided by urban transit, not even DC’s expensive Metro rail system has kept traffic from costing the average auto commuter $1,400 a year in wasted time and fuel.

Of course, one reason DC is number one in congestion is that, with the growth of government during the recent recession, it has enjoyed far more job growth than most other major urban areas. Yet, if rail transit really were such a good way to relieve congestion, it should have been able to absorb that growth.

Instead, the rail system operated by the Washington Metropolitan Area Transit Authority (WMATA) is actually losing capacity as maintenance shortfalls force the agency to run smaller trains and those trains become less reliable. Last summer, when passengers on the Green line were stranded and had to walk along the rail line in the summer heat, WMATA promised that the agency would improve its safety procedures and keep people better informed.

Continue reading

DC Metro Continues to Decline

It’s a sign of distinction that the Washington Metro Rail system has not one but at least two blogs dedicated to documenting the system’s poor operating condition. One of the blogs reports that, in July, MetroRail suffered from nearly 500 problems that led to a “deviation from normal scheduled service,” all but about 20 of which were due to maintenance failures.

The other blog reviews a recent WMATA report on the system’s health and concludes that “it’s the trains, stupid,” meaning that the train cars are experiencing so many breakdowns that “Metro should lay off the track work for a while” and concentrate on repairing the railcars.

The problem with that is that tracks and signals are responsible for lots of problems too. Broken rails are common, with an average of nearly one cracked rail a week in 2011. Faulty signals, of course, were responsible for the crash that killed nine people in 2009. Signals may cause the fewest number of equipment-related train delays, but nobody wants to admit they were busy fixing doors but letting people die because they neglected the signals.

European doctors proved that drinking mineral water keeps pancreatic viagra price canada juice and bile less acidic, liquid, and less “aggressive”. There is always a better choice for viagra online in uk try these guys sex pills. But regular stop of the urine in between viagra usa mastercard can cause harmful impact on the bladder. viagra canadian The effect generally takes about an hour or less depending on one’s body reaction. Continue reading

The Problem with Transit

Table 12 of the historical tables supplementing the 2010 Public Transit Fact Book reveals that, since 1970, the number of workers needed to operate America’s public transit systems has increased by 180 percent. Table 38 reveals that, in the same time period, the cost of operating buses, trolley buses, light rail, and heavy rail (the only modes whose costs are shown in 1970) increased by 195 percent (after adjusting for inflation using the GDP deflator).

Meanwhile, table 1 shows that ridership on buses, trolley buses, light rail, and heavy rail (again, the only modes shown in 1970), grew by a mere 32 percent. That means each transit worker produced 53,115 transit trips in 1970, but only 26,314 trips by all modes in 2008. In other words, by any measure, transit productivity has declined by more than 50 percent.

Continue reading

The Antiplanner’s Library: The Great Society Subway

Most DC visitors and residents consider the Washington Metrorail system to be a great success. Among them is Zachary Schrag, author of The Great Society Subway: A History of the Washington Metro. But, as Schrag clearly documents, by the standards of Metrorail’s original planners, it is a dismal failure.

Back in 1962, planners projected that a 103-mile rail system would cost less than $800 million — or about $4.6 billion in 2009 dollars. Moreover, they expected that fares would cover all of the operating costs and nearly 80 percent of the capital costs (pp. 53-54).

As it turned out, the actual 103-mile system that was completed in 2001 covers all of the basic routes of that original plan, yet cost $17.6 billion in 2009 dollars, close to four times the initial projection. Fares cover only about 60 percent of operating costs and, of course, none of the capital costs.

Continue reading