
The Texas legislature has declined to continue funding a train between Fort Worth and Oklahoma City. Amtrak calls the train a “vital transportation option,” but in fact few people ride it and it is a costly burden to Oklahoma and Texas taxpayers.

The Heartland Flyer stops in Norman, Oklahoma.
The train, Amtrak says, served “over 80,000 customers in FY24 and reach[ed] $2.2 million in ticket revenue,” which is supposed to somehow sound impressive. Amtrak’s press release fails to mention that the train cost $9.6 million to operate, not counting depreciation, which means it cost taxpayers at least $92 per rider, and probably much more. In short, taxpayers have to pay more than three quarters of the cost, much more than the average Amtrak train, for which taxpayers cover “only” about 59 percent of the cost (which is still too much). Continue reading


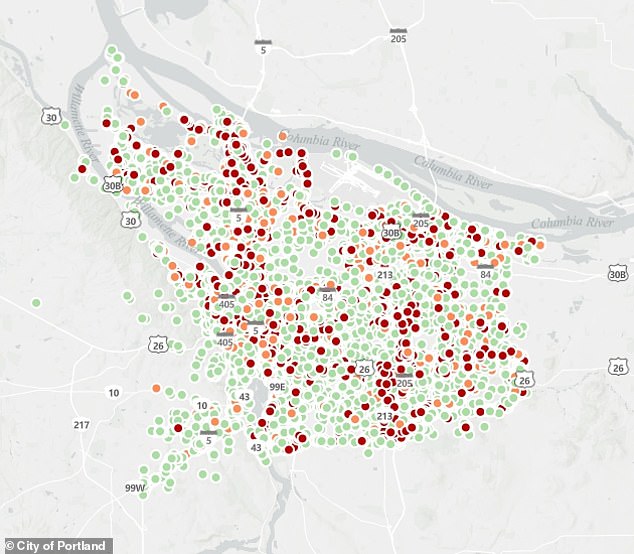 This map shows homeless camps identified by the city of Portland. Colors indicate the risk of crime each camp supposedly poses to nearby neighborhoods.


