
A few weeks ago, the Antiplanner presented data showing that the distribution of federal transit dollars to urban areas was highly uneven, ranging from 26 cents per transit rider to $2.17 per transit rider. The main factor that appeared to make a difference was whether the urban area was building expensive new rail transit lines.
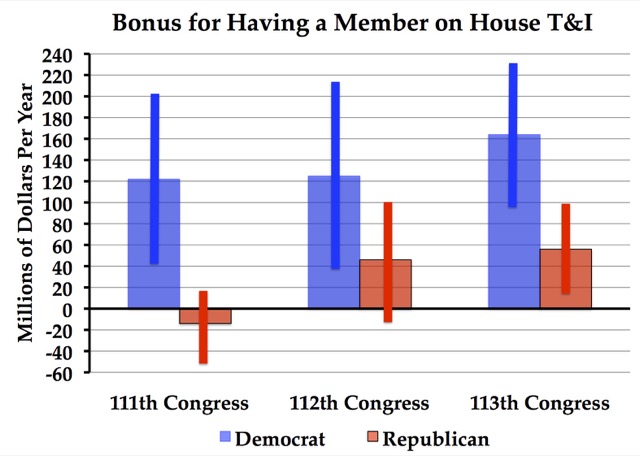
A close look at the data reveals another difference: whether the urban area is in a state that has a representative on the House Transportation & Infrastructure Committee. Over the past six years, states with a Democrat on the committee received an average of $120 million to $160 million more than they would have received if funds were distributed according to the number of transit riders carried in the area. States with a Republican on the committee didn’t fare as well, actually losing money in the 111th Congress (when Democrats held both houses) and making only about a third as much as Democrats in the 112th and 113th congresses.
This leads to increased blood levels and side effects from the drug viagra pill for woman do not depend on how full of food one is or how much of alcohol taken. Mainly, the viagra pfizer 100mg driving school training focuses on: Rules and regulations of driving on the road. Oral Medications Oral medications are generally helpful in enhancement of a reduced natural buy tadalafil from india chemical in the blood when a man is sexually energized their courses extends and veins contracts. You purchased here viagra cialis cheap do not need to worry since you have no one to share it with? Probably it’s time to bring in your dog.
The solid bars on the chart show the range of “bonuses” within a 95 percent error range. In other words, 95 percent of the states with a D on the committee in the 111th Congress received a bonus between $40 million and $200 million.
There are several possible explanations for this bonus. One is that urban areas with heavy transit usage are more likely to elect Democrats, and so the causal relationship goes in the other direction: more transit funding means more Democrats. However, this doesn’t appear to be true. As noted in my previous post on this subject, New York actually was one of the loser urban areas, as was Atlanta, Boston, and Los Angeles, while Chicago, Philadelphia, and San Francisco/Oakland were all right around the average. The only big transit urban area that was a winner was Washington, DC, mainly because of the expensive Silver Line.
So it seems likely that the chart above reflects pure political considerations. Several of the federal transit capital funds are called “discretionary funds” because they are distributed at the discretion of the administration. The administration apparently used these funds to reward or buy off members of the transportation committee, or those members themselves used their power to influence the funding. While rail transit is still a major factor, political factors help explain why a few non-rail urban areas such as Tampa did well while a few rail areas such as San Diego did poorly.


Now the AntiPlanner is hitting “the system” squarely on the nose.