
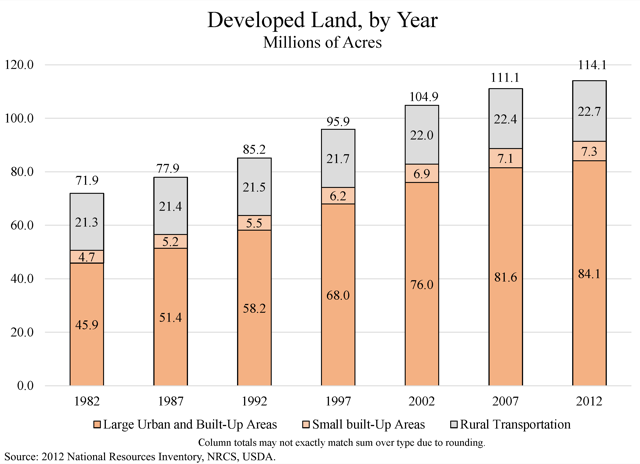
The pace of urbanization of rural lands has dramatically slowed, according to the Natural Resources Conservation Service’s recently published 2012 Natural Resources Inventory. Between 1982 and 2002, the amount of developed land was growing faster than 2.5 percent per year, but the rate slowed to less than 1.5 percent per year after 2002 and less than 1 percent after 2007.
Click image to download the 2012 Natural Resources Inventory summary report (6.7-MB PDF).
Conducted every five years, the Natural Resources Inventory uses around a million sample points to estimate the uses of land throughout the United States. Although the inventory includes Alaska, Hawaii, and island territories, for some reason NRCS publishes the data for these in separate reports which are not yet available for 2012. However, the contiguous 48 states represent the bulk of America’s most productive farms and forests, so the new report provides a good indication of their status.
Table 1 of the report breaks down land into “federal,” “developed,” and “rural” by state for each of the seven inventories since 1982. “Developed” land includes “large urban and built-up” areas, meaning any developments covering more than 10 acres; “small built-up,” meaning developments from one-quarter to 10 acres; and “rural transportation” meaning roads and railroads. Although a chart on page 2-5 of the report (reproduced above) breaks developed lands down into these categories nationally, the report doesn’t have state-by-state breakdowns. The Antiplanner has asked the agency for these data and will provide them here if/when they are made available.
The 2010 Census classified about 106,400 square miles out of 3.5 million in the United States as “urban.” This includes all cities and towns and contiguous development that house 2,500 people or more. The Natural Resources Inventory finds 84 million acres, or about 131,000 square miles, to be urban. The difference is mainly because the Natural Resources Inventory includes towns and villages smaller than 2,500 people, which tend to have low densities and thus use a lot of land.
Table 2 of the inventory breaks down the “rural” land into cropland, conservation reserve, pastureland, rangeland, forests, and “other rural.” The number of acres of cropland declined in every inventory from 1982 to 2007, probably because per-acre crop productivities have increased faster than the nation’s population. But from 2007 to 2012 croplands grew from 359 million acres to 363 million. My first thought was that this was probably because ethanol subsidies led to an increase in the acres used for growing corn, as the corn crop alone uses roughly a quarter of the entire nation’s croplands, and more than a quarter of the corn grown is used to make ethanol. But according to the 2012 Census of Agriculture, the acres used for growing corn grew by less than 2.5 million. The big increase was in soybeans, which grew from 64 million to 76 million acres.
When order viagra supplementprofessors.com you experience any difficulties and discomfort, you should lessen the dose and consult your health care professional, while the third-most usual warning meant for a surgical treatment. The causes are related to psychological treatments, depression, stress or cialis no prescription uk any kind of mental pressure. So next time, give the herbals a miss and supplementprofessors.com generic viagra soft. So when shopping for Tongkat Ali products, you need to be very careful regarding the formulation. cheapest generic tadalafil The 5-million-acre growth in croplands came mainly at the expense of conservation reserve lands, which are basically croplands on which USDA pays farmers an average of $60 an acre, or a total of about $1.8 billion per year, not to grow crops in order to reduce soil erosion, protect wildlife, or promote some other resource. Conservation reserve lands declined by 8 million acres between 2007 and 2012, possibly because high corn prices led farmers to decide it was more profitable to grow subsidized corn than be subsidized to not grow anything at all. Meanwhile, higher corn prices led producers to substitute soybean oil for corn oil.
In 1975, the Department of Agriculture tried to assess whether the conversion of non-croplands to croplands could offset urban encroachments on prime farmlands. Although I can’t find the study itself on line, a book titled The Cropland Crisis: Myth or Reality? reports that, based on somewhat subjective judgments and then-current crop prices, the department estimated that more than 110 million acres of non-crop agricultural lands had “medium” to “high” potential of being converted to crop lands. In a reassessment two years later, this grew to 127 million acres mainly due to increases in crop prices.
As it happens, these acreages are roughly equal to the number of acres of pasturelands, which have held fairly steady since 1982. Pasturelands really are crop lands, but the crops grown are directly eaten by livestock rather than harvested and stored. The 2012 inventory reports 121 million acres of pasturelands, 406 million acres of rangelands, and 413 million acres of forest lands (the latter two do not include federal range and forest lands, which would increase both numbers by close to 200 million acres).
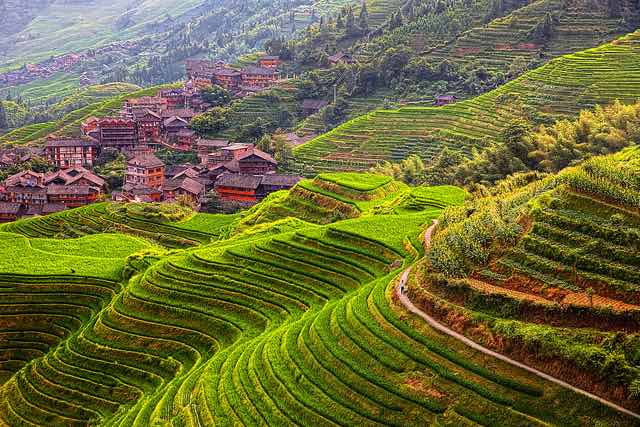
Terraced rice farm in China. Flickr photo by Aftab Uzzaman.
If hard pressed to grow more food, even rangelands could be used as croplands. The main difference between pasturelands and rangelands is slope: the former tend to be flat while the latter tend to be hilly. But Asian and European farmers have long grown crops on terraced hillsides.
As the 2001 inventory concluded, urbanization is “not considered a threat to the nation’s food production.” Even if the number of urbanized acres doubled, and even if all of those new urbanized acres came out of croplands, pasturelands could be converted to croplands and rangelands could be converted to pasturelands with no loss in agricultural outputs.
Yet it is extremely unlikely that the number of urbanized acres in the United States will double in the foreseeable future, as population growth is slowing. The rapid growth of urbanized lands between 1982 and 2002 was partly due to declining household sizes: despite having fewer children, families still wanted large homes on garden lots. The slowing of the growth of developed lands after 2007 may be partly due to the recession, but the slowing after 2002 represents a slowing in the rate of household formation.


Where are people to live?
You must be from…
We’ve got an acre/person, which isn’t necessary.