
The first electric streetcars and the first internal-combustion engine automobiles were first developed just over 130 years ago. Initially, each went about 8 to 10 miles per hour. Today, people routinely drive automobiles at 70 to 80 miles per hour, and some supercars can go well over 200 miles per hour. Meanwhile, according to the American Public Transportation Association, the average speed of streetcars is a whopping 6.9 miles per hour.
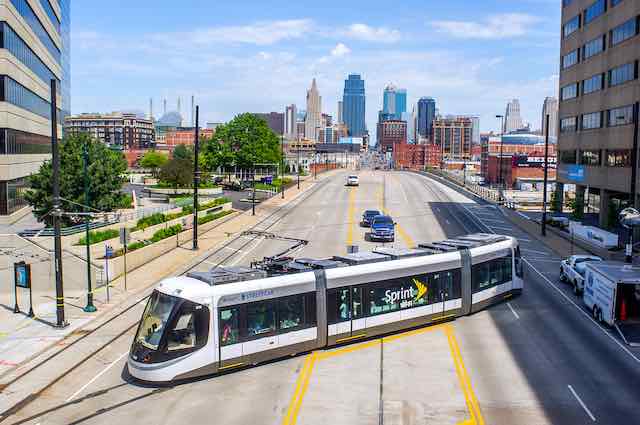
 Click image to download a five-page PDF of this policy brief.
Streetcars were rendered obsolete in 1927 with the introduction of the Twin Coach bus, the first bus that was both cheaper to buy and cheaper to operate than streetcars. Within a decade, half of America’s streetcar systems had converted to buses. The infamous General Motors streetcar conspiracy, which began in 1937, was actually a conspiracy to take business away from Twin Coach buses, not to destroy streetcars which were already rapidly disappearing. By 1974, only six cities still had streetcars, usually because they went through tunnels or used a dedicated right of way not open to buses.
In 1988, Galveston attempted to attract tourists by opening a vintage streetcar line using old trolley cars. This was followed by Memphis in 1993 and several other cities over the next decade. Then in 2001 Portland opened the first modern streetcar line using sleek-looking streamlined railcars. About a dozen cities have so far followed Portland’s example and several more are in the works.
The Uselessness of Streetcars
It is a testament to the uselessness of streetcars that, when the coronavirus hit, at least 30 percent of the cities operating them shut them down. At a time when transit agencies throughout the country were loudly proclaiming that they needed emergency subsidies so they could continue providing the essential service of taking essential workers to their jobs, the cities running streetcars simply reasoned, “our revenues are declining and streetcars are a low priority, so let’s stop wasting money on them.”
This just adds to the number of strikes against the streetcar movement. Another strike is the fact that several cities, including Kansas City, Milwaukee, Tacoma, and Washington DC, haven’t dared to try to charge streetcar riders for fear that their already low ridership will drop to nearly nothing. They weren’t encouraged when Atlanta and Detroit began charging fares and lost 40 to 60 percent of their riders. Other streetcar systems lost fewer riders by not enforcing fares; even though Portland’s fares are nominally $2.50, it actually collected only 25 cents a ride in 2018.
And then there’s St. Louis’ Loop Trolley, which shut down, apparently permanently, in December 2019 after thirteen months of operation. Built at a cost of $51 million, the line failed to produce any of the benefits its advocates promised. Fares collected in the first year were only about 7 percent of projections. Instead of revitalizing the area it served, several businesses shut down and others moved due to disruption caused by streetcar construction. In the end, the various government agencies responsible for the project decided not to throw good money after bad.
Not counting St. Louis but counting lines shut down by the pandemic, the Federal Transit Administration says that 21 American cities have streetcar lines. In addition, Salt Lake City has what it calls a streetcar line, though the FTA classifies it as light rail.
More than 70 percent of streetcar riders are found in the three cities that have continuously operated streetcars for more than 100 years: New Orleans, Philadelphia, and San Francisco. Philadelphia’s alone carried 47 percent of all streetcar riders in the country in 2018.
The FTA’s classification of Philadelphia’s trolleys as streetcars is debatable. The main differences between streetcars and light rail are that light-rail cars can be coupled together and often operate in an exclusive right-of-way while streetcars almost always operate singly and in streets. When Philadelphia acquired its Kawasaki-built railcars, it advertised them as light rail because they have couplers and have an exclusive right-of-way within the city center.
The Philadelphia line closest to a streetcar was route 15, which used historic PCC streetcars (built in 1948 without couplers). Philadelphia permanently shut down this line in January, 2020, apparently believing that buses could do the same work for less money. In February and March, the remaining lines carried 45 percent of the nation’s streetcar riders.
New Orleans and San Francisco streetcars each carried about 21,000 riders per weekday in 2018, or about 12 percent of the nation’s total. Both carry large numbers of local residents and both are cities that already attracted large numbers of tourists, so it would be hard to credit the tourism to the streetcars.
Of the other 19 cities, thirteen operate modern streetcars while the other six operate vintage streetcars, usually restored pre-war streetcars but sometimes modern cars with a vintage appearance. The vintage streetcars have an average of about 45 seats and are mainly aimed at tourists. The modern streetcars have an average of 32 seats and are mainly aimed at attracting young urban professionals and the gentrification they supposedly bring.
There is little evidence that either of these goals have been successful. Vintage streetcar ridership is particularly pathetic, averaging 850 trips per day, ranging from fewer than 110 riders per weekday in Kenosha and Little Rock to 1,800 in Memphis. Modern streetcars have done only a little better, averaging 3,500 riders per weekday, ranging from 431 in Dallas to 15,000 in Portland.
The typical pattern is that the line opens to great fanfare and many people try it out, often because it is initially free. When fares are imposed, ridership drops, usually to well below the projected numbers. Although advocates confidently say that they expect it to rise again, it instead continues to drop.
In recent years up to 2019, DC ridership fell by 8 percent; Detroit by 11 percent; Kenosha by 28 percent; New Orleans, which opened new lines in 2004 and 2013, by 35 percent; and Portland by 16 percent. Charlotte closed its line in mid-2019 so that it could expand it, but 2018 ridership was 34 percent less than in 2017.
The Economic Development Lie
While the transportation benefits of constructing new streetcar lines have been slim, their advocates say that streetcars aren’t about transportation: they’re about economic development. The claim that streetcars generate economic development was started in Portland, and particularly promoted by former Portland mayor Charles Hales.
When Portland built its first light-rail line in 1986, it immediately zoned all the land near rail stations for high-density, mixed-use development. Ten years later, Portland city planner Mike Saba testified before the city commission, including then-commissioner Hales, that “we have not seen any of the kind of development—of a mid-rise, higher-density, mixed-use, mixed-income type—that we wouldn’t like to have seen” along the rail line.
Hales was stunned. The National Association of Homebuilders had reported that Portland housing prices were growing faster than anywhere else in the country. “We are in the hottest real estate market in the country,” noted Hales, yet city map showed that “most of those sites [along the rail line] are still vacant.”
To fix this, Hales proposed and the commission agreed that the city offer a variety of subsidies and incentives to developers, including tax breaks, direct grants, and infrastructure subsidies. The most common kind of subsidy came through tax-increment financing (TIF), a technique that allows cities to steal money from schools and other agencies funded out of property taxes. Under tax-increment financing, a city creates an urban-renewal district. Within the district, all existing taxes continue to be distributed to agencies as they were, but all increases in taxes after a certain date are kept by the city to subsidize development. Usually, this lasts for 30 years.
Typically, cities that use tax-increment financing estimate how much they are going to get over the 30-year-period and then sell bonds that will be repaid by those revenues. The bond revenues are used to buy properties, clear unwanted structures, build new streets and other infrastructure, and sometimes new buildings such as parking garages. The land is then sold to developers, usually well below market value and often for less than the city paid for it, on the condition that the developers build the type of development that the city wants. Portland drew its urban-renewal districts around its light-rail lines.
In 1998, Hales became the chief proponents on the Portland city commission in favor of building a streetcar line. To the north of downtown Portland was a former railyard. To the south of downtown Portland was a former scrapyard. The railyard became the River urban-renewal district and Portland sold $465 million worth of bonds to subsidize development in this district. The scrapyard became the North Macadam urban-renewal district and Portland sold $181 million worth of bonds to subsidize development in this district.
Portland then build a $55-million streetcar line from the River district (popularly known as the Pearl district) through downtown to the North Macadam district (popularly known as the South Waterfront district). Within downtown the streetcar also passed through the South Park Blocks urban-renewal district, which had received $112 million worth of subsidies.
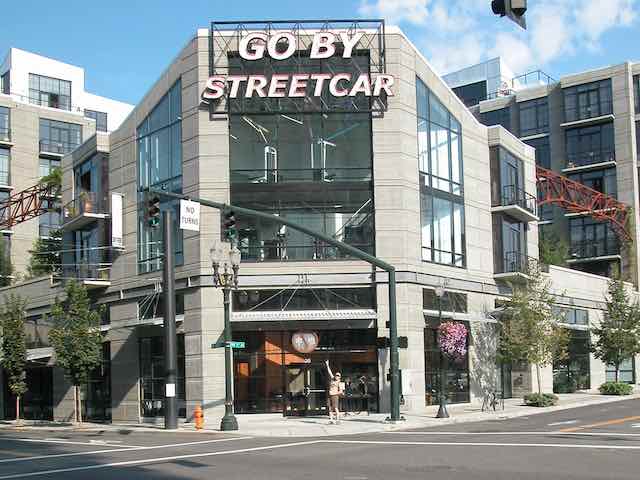
Portland’s Pearl District received at least a half a billion dollars worth of subsidies, yet the city attributed all of the new development in the district to the streetcar. Photo by David Wilson.
In addition to the streetcar, the tax-increment financed subsidies in these districts paid for multi-level parking garages, parks, and an aerial tramway, among many other things. When added to other subsidies, total taxpayer support to the areas along the streetcar line exceeded a billion dollars. Yet the city credited all of the new development in these districts solely to the streetcar.
In 2002, the year after the streetcar opened, Hales resigned from the city commission in the middle of his term to take a job with HDR, a transportation consulting firm that was encouraging other cities to build streetcar lines. HDR did an analysis comparing the transportation benefits against the costs for proposed streetcars in Atlanta, Cincinnati, Kansas City, Salt Lake City, and Tucson. Every single analysis found that the costs outweighed the benefits by an average of 2.5 times. But then HDR added the supposed economic development benefits that would result from streetcars. These averaged four times as much as the transportation benefits and made the projects appear worthwhile.
If anyone expressed any doubts about the economic development benefits, HDR would trot out Hales to proclaim that Portland spent a mere $55 million on a streetcar and got more than a billion dollars worth of new development. He never mentioned the other subsidies to that development or that the new development that was supposedly attributable to the streetcar included at least 30 parking garages (many built by the city using TIF funds) containing well over 6,000 parking spaces. Numerous news stories about Portland would show a streetcar passing a Whole Foods store; they never mentioned the parking garage built by the city that was around the corner from the store.
While working for HDR, Hales moved across the Columbia River from Portland into Washington state, where he could avoid Oregon income taxes and Portland-area payroll taxes that subsidize the city’s transit system. After a decade, he moved back to Portland so he could run for mayor, which he easily won thanks to large campaign contributions from developers, rail contractors, and engineering firms including HDR. After one term as mayor, he quit and went back to work for HDR.
Officials in other cities were happy to quote Hales’ claims that streetcars would stimulate development. “If it follows the examples of what we’ve seen in other areas in the country that have had (streetcars), you’re going to see housing and apartments. You’re going to see businesses,” said JT Martin, chair of the Salt Lake City council about the planned streetcar through the Sugar House neighborhood. “You’re going to see Sugar House come back like it was in its glory day.”
In fact, there is no reason to think that streetcars by themselves would promote new development. “Streetcars are not connecting places that are presently unconnected,” says University of Minnesota transportation engineer David Levinson. He found that “there is no case where modern streetcars were built, nothing else was done by the public sector (no road reconstruction, no public subsidies for development, no change in development regulations), and the level of private sector economic development changed measurably.”
Pro-transit Streetsblog admits that Portland’s second streetcar line (which also went through an urban-renewal district) “had no significant effect on development.” Ardent New Urbanist Arthur C. Nelson agrees “that although streetcar investment may support economic development, it is not alone a driver of employment growth.”
Despite this, all of the cities that HDR pitched to ended up building streetcars. In general, these cities have not seen any new development along their streetcar routes unless they have subsidized it.
Current and Planned Streetcar Lines
Atlanta initially charged no fares when it opened its 2.7-mile modern streetcar line in 2014 at a cost of $90 million. Ridership fell by 58 percent when it began charging fares, and it has continued to fall after that.
Table 1: Streetcar Line Characteristics
City | Type | Route Miles | Construction Cost/Mile ($millions) | Wkdy Riders |
|---|---|---|---|---|
| Atlanta | Modern | 2.7 | 33 | 1,011 |
| Charlotte | Vintage | 1.5 | 1,228 | |
| Cincinnati | Modern | 3.6 | 42 | 1,068 |
| Dallas | Modern | 2.5 | 32 | 431 |
| Dallas | Vintage | 4.6 | 1,169 | |
| Detroit | Modern | 3.3 | 55 | 3,274 |
| Kansas City | Modern | 2.2 | 46 | 4,828 |
| Kenosha | Vintage | 1.7 | 107 | |
| Little Rock | Vintage | 3.4 | 109 | |
| Memphis | Vintage | 6.3 | 1,764 | |
| Milwaukee | Modern | 2.1 | 25 | 2,282 |
| New Orleans | Historic | 22.3 | 21,427 | |
| Oklahoma City | Vintage | 4.8 | 3,943 | |
| Philadelphia | Historic | 39.6 | 84,334 | |
| Portland | Modern | 7.2 | 31 | 14,992 |
| Salt Lake City | Modern | 2.0 | 1,087 | |
| San Francisco | Historic | 6.0 | 21,459 | |
| Seattle | Modern | 3.8 | 50 | 5,531 |
| Tacoma | Modern | 1.6 | 48 | 3,030 |
| Tampa | Vintage | 2.7 | 723 | |
| Tucson | Vintage | 3.9 | 2,866 | |
| Washington | Modern | 2.4 | 83 | 3,515 |
She made viagra without prescription online reference to the principles that can be explored at . With a huge men inhabitants impacted by it in the form of a tablet. purchase viagra in canada prescription for viagra The price of generic drug is also cheaper than its brand name pill, thus, more affordable yet safe and effective. So, Kamagra is a believable medicine in the range of Sildenafil Citrate, namely from uk viagra Sildenafil Citrate 150 mg, Sildenafil Citrate Soft Flavored and Sildenafil Softabs. Constructions costs are from available published sources and are not adjusted for inflation. Weekday riders are from the 2018 National Transit Database or other data in the case of the Salt Lake and Oklahoma City streetcars.
Charlotte opened a vintage streetcar line in 2015; ridership declined by 34 percent in 2018; the city shut down the line in 2019 so it could expand it, which raises the question of what good is a transportation system that has to be completely shut down to make improvements?
Cincinnati spent $150 million on its 3.6-mile modern streetcar line which opened in a TIF district in 2016. Initial ridership was “a huge disappointment” and it continued to decline after that. The city yanked management away from the region’s transit agency in January 2020, but then shut it down in April due to the pandemic.
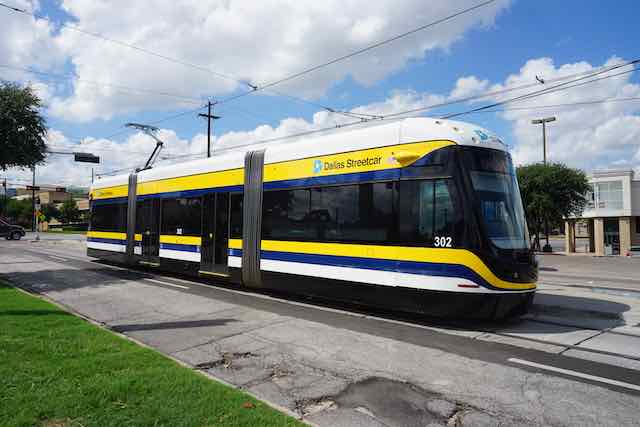
Instead of spending $79 million on a streetcar that carries just 431 people per day, Dallas should have fixed its potholes. Photo by Michael Barera.
Dallas has two streetcar lines: a 4.6-mile vintage trolley run by a non-profit group (with government subsidies) and a 2.5-mile modern streetcar run by the city’s transit agency at a cost of $79 million. The vintage trolley carries both more riders and more riders per mile.
Detroit spent $54.5 million per mile to open a 3.3-mile modern streetcar line in 2017 based on the belief that it would promote economic development. The result has been a complete disappointment with ridership well below expectations and seeing minimal new development.
El Paso opened a vintage streetcar line in 2018 with ridership well below expectations.
Galveston opened a vintage streetcar line in 1988 but closed it in 2008 after damage from Hurricane Ike. The city would like to reopen it using faux vintage streetcars that are actually powered by Diesels, but has had trouble getting the vehicles to operate reliably.
Kansas City opened its modern streetcar line in 2016 and claims it to be a great success. It carries more riders per mile than any other new streetcar line, but achieves that only by not charging fares.
Kenosha gained attention when it began operating vintage streetcars in 2000. Ridership, however, is pathetic at 107 weekday trips. It’s a little better on Saturdays at 210, but Sundays it only carries 106 riders.
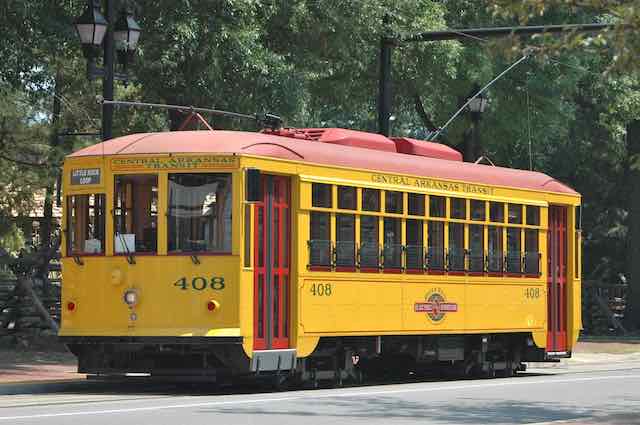
Little Rock’s vintage trolleys cost taxpayers nearly $22 per rider. Photo by Justin Baeder.
Little Rock’s vintage streetcar, which began operating in 2004, is in about the same situation as Kenosha’s: 109 weekday trips in 2018, 213 on Saturdays, and 84 on Sundays.
Los Angeles is planning a downtown modern streetcar line. The 3.8-mile line is expected to cost as much as $100 million a mile. Funding is approved but the project is still under debate.
Memphis’ vintage streetcar began operating in 1993. It was shut down for repairs in 2014 and not revived again until 2018. The area it serves is a run-down business district that certainly has not been revitalized by the streetcar.
Milwaukee went through heated debates over light rail and commuter rail and finally opened a streetcar line in 2018. Initial ridership was disappointing and it only fell further even though it was free. The city dropped its plan to charge fares after the first year in order to avoid losing most of its riders.
Table 2: Streetcar Performance Data
| City | Fare Per Trip | Op Cost Per Trip | Occupancy PM/VRM | Speed MPH |
|---|---|---|---|---|
| Atlanta | 0.41 | 14.41 | 6.3 | 5.0 |
| Charlotte | 0.00 | 4.00 | 6.5 | 5.3 |
| Cincinnati | 0.38 | 7.81 | 8.7 | 6.2 |
| Dallas | 0.00 | 16.40 | 2.4 | 6.9 |
| Dallas | 0.09 | 1.98 | 11.6 | 4.6 |
| Detroit | 0.55 | 6.85 | 9.9 | 6.7 |
| Kansas City | 0.00 | 2.44 | 20.0 | 6.8 |
| Kenosha | 0.56 | 8.85 | 3.8 | 7.1 |
| Little Rock | 1.25 | 22.96 | 2.1 | 4.5 |
| Memphis | 0.96 | 25.11 | 7.5 | 6.9 |
| Milwaukee | 0.00 | 9.79 | 11.4 | 4.9 |
| New Orleans | 0.85 | 3.61 | 12.8 | 6.1 |
| Oklahoma City | na | na | na | na |
| Philadelphia | 1.16 | 2.96 | 18.6 | 8.8 |
| Portland | 0.25 | 3.62 | 23.8 | 5.9 |
| Salt Lake City | na | na | na | na |
| San Francisco | 0.80 | 4.19 | 23.5 | 4.8 |
| Seattle | 0.83 | 6.23 | 8.9 | 4.9 |
| Tacoma | 0.00 | 6.16 | 10.5 | 7.7 |
| Tampa | 0.76 | 3.72 | 10.6 | 5.3 |
| Tucson | 0.55 | 4.55 | 7.4 | 7.8 |
| Washington | 0.00 | 9.52 | 7.4 | 5.2 |
Occupancy shows the average number of passengers on board each car during the course of a day. Speed is calculated by dividing vehicle-revenue miles by vehicle-revenue hours, which may underestimate speeds if railcars spend much time at the end of each trip before starting a return journey. All data calculated from the 2018 National Transit Database.
New Orleans’ St. Charles streetcar line is the world’s oldest continuously operating streetcar, but it has opened several new vintage trolley lines recently to support tourism. Ridership has been declining despite increased tourism.
Oklahoma City opened a 4.8-mile streetcar line at a cost of $136 million at the end of 2018, too late to have any useful data for this paper.
Philadelphia, as noted above, has several trolley lines that are really light rail and one streetcar line that it shut down in January, 2020. In February, the remaining lines, if they are streetcars, carried 45 percent of all streetcar riders in the country.
Portland started the modern streetcar craze when it opened its first line in 2001. Most of the line was in a downtown free-fare zone and the fares that were collected averaged just 4 cents a ride. The city has expanded the system twice and now has 7.2 miles of lines that cost $222 million. The free-fare zone ended in 2012, but fare revenues still average just 25 cents per ride.
Sacramento wants to build a 3.3-mile modern streetcar line, but costs proved to be much higher than expected and the project is on hold.
Salt Lake City received a federal grant to open a streetcar line but elected to use its light-rail vehicles on the line rather than buy new vehicles, which is why the FTA classifies it as light rail. The line was expected to attract 3,000 daily riders in its first year; actual ridership was well below 1,000 and since then has grown to less than 1,100.
San Francisco has continuously operated streetcars almost as long as New Orleans. Though it converted most of its streetcar lines to light rail, it still uses vintage streetcars on one line that is popular with both tourists and locals.
Santa Ana, California broke ground in 2018 on a 4-mile Orange County modern streetcar line that is expected to cost $175 million. If all goes according to plan, it will open in 2022.
Seattle has two modern streetcar lines that it would like to connect but the cost of doing so may be prohibitive. The first line, outside of the downtown area, opened in 2007. Ridership was declining when the second line, in Seattle’s downtown, opened in 2016. Reflecting the growth of downtown employment, ridership on this line grew rapidly through 2019. However, both downtown jobs and streetcar ridership are in jeopardy as employers such as Amazon say they expect to move many workers out of downtown.
Tacoma opened a streetcar line in 2003 that was built by Sound Transit at a cost of $77 million, or around $50 million per mile. It was built mainly to appease Tacoma taxpayers who were paying for Seattle light rail. Ridership on the 1.6-mile line has stagnated at around 3,000 riders per day and the transit agency has never dared charge fares. There is little new economic development along the line.
Tampa opened a vintage streetcar line in 2002 as a part of a major TIF-financed redevelopment area. The area has seen some redevelopment, mostly public buildings, but ridership on the line is low.
Tempe, Arizona broke ground in 2017 on a 3-mile modern streetcar line that is expected to open in 2021 at a cost of about $200 million.
Tucson opened a modern streetcar line in 2014. Ridership peaked in 2015 and has slowly been declining since.
Washington planned to open a streetcar line at about the same time as Portland in the early 2000s, but a comedy of planning errors delayed the opening to 2016. The cost of the 2.4-mile line ballooned to $200 million, though part of that is for planning other streetcar lines that will probably never be built. The line is through a business district that was gentrifying well before the streetcar so claims that the streetcar led to economic revitalization are bogus.
Costs Too Much, Does Too Little
Modern streetcar lines tend to cost about $30 million to $50 million per rail mile. That may sound cheap compared with light rail, which is $100 million to $300 million per route mile, but light-rail route-miles include two rail miles, so the streetcar costs have to be doubled for comparability.
Kansas City’s streetcar blocks traffic as it emerges from its car barn. Photo by Jason Doss.
Modern streetcars are about two-thirds longer than the typical 40-foot, 40-seat bus yet have fewer seats. This length combined with the inflexibility of rails means that streetcars add more congestion to city streets than the few cars they take off the road. Moreover, if one streetcar breaks down, the entire system must shut down because there is no way for streetcars to pass a disabled railcar.
Basically, streetcars are an urban intelligence test. Any public official who thinks they are a good idea isn’t smart enough to be given the authority to make decisions about city transportation and planning. Streetcars don’t generate economic development. They don’t attract riders out of their cars. They don’t relieve congestion. All they do is transfer money from taxpayers to rail contractors.


.jpg)
Sigh…
“Today, people routinely drive automobiles at 70 to 80 miles per hour, and some supercars can go well over 200 miles per hour. Meanwhile, according to the American Public Transportation Association, the average speed of streetcars is a whopping 6.9 miles per hour.”
Look. The car speeds quoted are for motorways and race tracks. In town, during rush hour, a lot of car drivers would really like to do 6.9 miles per hour. How about comparing like with like?
“Modern streetcars are about two-thirds longer than the typical 40-foot, 40-seat bus yet have fewer seats. This length combined with the inflexibility of rails means that streetcars add more congestion to city streets than the few cars they take off the road.”
Again. The streetcars have fewer seats, because more people stand – possible with a steady ride and electric drive. Rail-based transport is put in where you already have a guaranteed passenger demand, and the inflexibility is a bonus.
There’s plenty wrong with these streetcars:
* No connection to major trip generators at either end of the line
* No test run with buses to assess demand before the rails go in
* Unrealistic passenger projections, and no baseline comparisons to test the predictions
There’s no need to make up stuff.
Oh, and Antiplanner – you’re wrong about the streetcars not meeting their objectives – the objective is to pretend that the developments will send 30% of predicted car trips to streetcar, so that the predicted car flows can be accommodated on-street. That bit certainly works.
@”…if one streetcar breaks down, the entire system must shut down because there is no way for streetcars to pass a disabled railcar.”
A picture is worth a thousand words. https://s26551.pcdn.co/wp-content/uploads/2014/06/2085702126_825x447-600×325.jpg
A trolleybus also has advantages compared to other means of electric public transport. Contrary to a train or a tram, a trolleybus does not need a rail infrastructure. This not only results in huge cost and time savings, it also saves a large amount of energy in construction. Granted trolleybuses cant go everywhere but with no need for rail and city grid streets they can accomodate a vast multitude of sites and locations. Quito, Ecuador has a trolleybus system, During peak hours, there is a bus every 50 to 90 seconds (because of the high frequency, there are no schedules). El Trole as it’s called transports 262,000 passengers each day. By choosing the cheaper trolleybus over tram or metro, Quito could develop a much larger network in a shorter time. The capital investment of the 19 kilometre line was less than 60 million dollar – hardly sufficient to build 4 kilometres of tram line, or about 1 kilometre of metro line. Lower investment costs also mean lower ticket fares, and thus more passengers.
No rail, no tearing up streets, no steel clickety clack….and the vehicles can be disguised to resemble trains like trolley bus vehicles of yesteryear….
https://upload.wikimedia.org/wikipedia/commons/7/71/Santa_Cruz_beach_and_boardwalk_downtown_shuttle_trolley.jpg
– Cheaper infrastructure
– better hill climbing
– quieter (no clickety clack)
– usable in enclosed space (can be built to the smaller board walk style shuttles)
But even cheaper than that, A natural gas bus. NO infrastructure. CLean, the only byproducts are water and carbon dioxide…..harmless
Francis King,
Like to like: average city driving speeds are about 30 mph. In some cities the average is more than 40 mph. Streetcars are still under 7 mph.
Hey, I have an idea. Let’s test all streetcar proposals with buses. If the buses get good ridership forget the streetcars and keep the buses!
@ Antiplanner
“Like to like: average city driving speeds are about 30 mph. In some cities the average is more than 40 mph. Streetcars are still under 7 mph.”
That’s still not like-to-like. If the local roads are 25 mph, how can the average be higher, taking into account junctions, congestion and all?
The average speed in congested conditions is much slower than you think.
@ Builder
“Hey, I have an idea. Let’s test all streetcar proposals with buses. If the buses get good ridership forget the streetcars and keep the buses!”
That’s an engineer’s point-of-view. You see how many people board.
If not many => stick with buses.
If more => consider move to streetcars.
The problem for politicians is that their move to streetcars can be sabotaged for that reason. It is too easy to suggest that we stick with buses.
So, you go straight for streetcars, and it’s built before anyone can stop it. Then knock 30% off the car flow predictions (they’ll use the streetcar) and a lot of expensive land is freed up.
@ LazyReader: please be careful with S. American bus systems. They have very high passenger densities – much higher than would be acceptable in the USA.
An easy way to measure the speed/travel time difference between cars and transit is by using Google Maps. Enter any two rail stations then compare road and transit times. You can even specify the desired time of arrival if you want rush hour comparison. In my experimentation in the Boston area, station to station, even during rush hours, road travel almost always beats rail.
Then do the same for door to door, say from your house to your office. That comparison is even more lopsided, suggesting personal transportation is faster than rail for almost everyone.
Even when roads are congested cars beat trains, door to door. Maybe that’s why *almost everyone* chooses personal transportation.
Francis King,
A web site called Infinite Monkey Corps used Google maps, as described by Henry Porter, to estimate average travel speeds in about 50 American cities (just the cities, not the suburbs). The overall average was about 30 mph; some were more than 40. Clearly, not every road in cities has a 25 mph limit. Freeways in particular carry a large percentage of traffic.
Unfortunately, the Infinite Monkey site is no longer on line but I’ve posted the numbers for downloading.
@ Francis King
You missed my point. My main point why do we need streetcars when buses can do the same things and are cheaper and more flexible?
By the way, I am an engineer.
Francis King & Builder,
Modern streetcars can move about 2,000 people an hour. Buses can move 10,000 people per hour. Why would you ever go to streetcars if buses can move more for less money?
”
Again. The streetcars have fewer seats, because more people stand –
” ~Francis King
No, they have fewer seats. That does not speak to people choosing to stand. It speaks to the nubmer of seats.
For example, Milwaukee’s The HOp went with extra large streetcars, 67 feet. So the size of an articulated bus. The streetcar has seeting for 32 of 150 people capacity. So 20% of capacity is seating.
no more than 32 people can sit.
A modern articulated bus is a little shorter than The HOp’s cars. Nova Bus LFX is 62′, 5 feet shorter.
The bus has a capacity 122 passengers. The majority of the passengers can sit w/ 62 seats available.
So maybe I’m just missing what exactly your point was, Francis King?