
The United States had 2.3 million more workers in 2019 than in 2018, and more than 30 percent of the increase worked at home. This boosted the share of people who worked at home from 5.3 to 5.7 percent.
 Click image to download a five-page PDF of this policy brief.
Historian Stephen Davies observes that a major pandemic does not “introduce something novel.” Instead, “it accelerates and magnifies trends and processes that were already under way.” It can also bring “a final stop to processes that were already exhausted.” People working at home is an example of a trend that is being accelerated and magnified by the COVID-19 pandemic.
Last week, the Census Bureau released American Community Survey data for 2019, providing the last snapshot of pre-pandemic America. Close scrutiny of these data can reveal trends that may be magnified by the pandemic and other processes that were already exhausted. This week’s policy brief will focus on transportation data in the survey; next week will look at housing.
The survey asked about 3.5 million households several transportation-related questions: How many vehicles were in their household? How did people in their household “usually get to work last week?” What time did they usually leave for work? How many minutes did it take them to get to work?
The answers to at least some of these questions can be broken down by race, sex, age, occupation, income class, poverty status, and number of vehicles in the household. Most of these data are available for all 50 states (plus DC and Puerto Rico), up to 840 counties (out of about 3,140), up to 634 cities and “census-defined places” (out of about 25,000), and up to 435 urbanized areas (out of about 480), as well as other geographical classes. The Census Bureau has conducted this survey every year since 2005, and used similar surveys in the 1960 through 2000 decennial censuses, so the numbers can be compared over time, geography, and groups of people.
Vehicle Ownership
In 1960, nearly 22 percent of American households didn’t have a car, while only 2.5 percent owned three or more cars. By 2019, more than 22 percent had three or more cars, while less than 9 percent lived without a car.
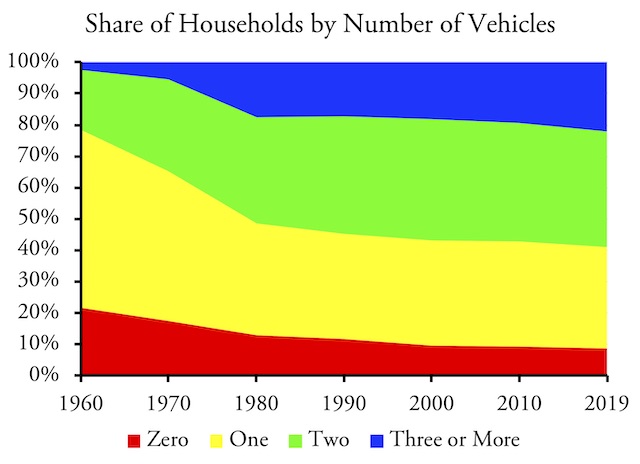
One trend likely to be continued or accelerated by the pandemic is an increasing number of vehicles per household. I’ve posted a 2019 spreadsheet showing households by number of vehicles for states, counties, cities, and urban areas.
The share of households without vehicles declined steadily through 2018, though it increased slightly in 2019 from 8.55 to 8.61 percent. The share of one- and two-vehicle households has also been shrinking. Meanwhile, the share of households with three or more vehicles has been growing. That means that fewer households with multiple workers have to carpool to work or have one person take transit.
A large share of vehicleless households are in New York or a handful of other dense urban areas with lots of transit. The New York urban area alone accounts for 21 percent of them, while New York plus just 19 other urban areas have half of vehicleless households. Predictably, these include Boston, Chicago, Washington, and San Francisco, but surprisingly they also include Houston, Dallas, and Phoenix. Many in the former group, at least, could afford to own a car but choose not to.
Another group of households without vehicles also have no workers who might use a vehicle to commute. As will be described in more detail below, only 4.3 percent of workers live in households without vehicles, so a high percentage of vehicleless households must have no workers.
Unfortunately, the Census Bureau doesn’t have a table showing vehicles per household by income. However, based on the 2017 National Household Transportation Survey, I’ve previously estimated that 6.8 million low-income households would prefer to have a car but can’t afford one. That suggests that a third of households without cars could afford to own one if they wanted to.
One proxy for income is race, as black per capita incomes are sadly just 58 percent of white’s. Vehicle data by race are not yet available for 2019, but in 2018 blacks had 1.7 vehicles per household while Latinos and non-Hispanic whites had 2.2. More than 13 percent of blacks had no vehicles, while 7.0 percent of Latinos and just 3.4 percent of non-Hispanic whites lived without vehicles. Blacks and other low-income households are likely to significantly increase their vehicle ownership rates in the future.
How People Commuted to Work
The automobile has been the main method of commuting since at least 1960, when the Census Bureau first collected these data. In that year, just over two out of three workers went to work by auto. The Census Bureau didn’t break out driving alone vs. carpooling until 1980, by which time driving alone accounted for almost two-thirds of workers, with carpooling being another 20 percent. By 2000, driving alone reached 76 percent, a number around which it has hovered ever since—in 2019, it was 75.9 percent.
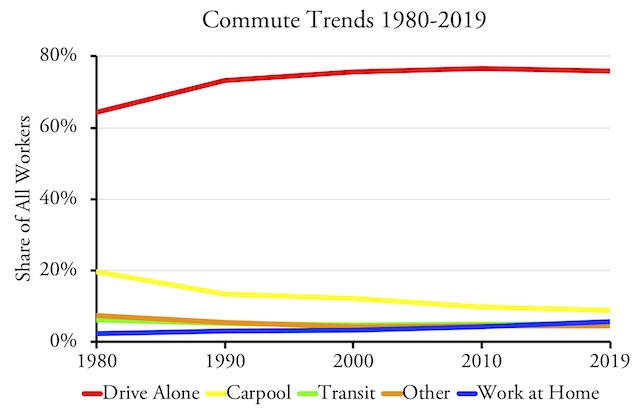
Driving alone to work has leveled off at 76 percent of workers, but carpooling continues to decline as working at home grows. I’ve posted a spreadsheet showing 2019 methods of commuting for states, counties, cities, and urban areas.
Carpooling, however, had declined to 12 percent in 1980, falling below 10 percent in 1990 and under 9 percent in 2017, which is also where it is today. While there is a stereotype of people filling their car with co-workers on their way to work, three-fourths of carpools have just two people in the car and these are mostly families. This type of carpooling has declined since 1990 as family sizes shrank and they bought enough cars for all of the driv- ers in the household. The other quarter, which has grown since 1990, has more than two people in the car and these are mostly groups going to the same job site.
Transit carried 12.6 percent of workers to their jobs in 1960, but this fell to below 5 percent in 2000. Since then it has fluctuated around that number, some years gaining a tenth of a percent or two (usually at the expense of carpooling), some years losing. Between 2018 and 2019, it grew all the way from 4.93 to 4.96 percent.
More than 10 percent of workers walked to their jobs in 1960, a share which fell below 3 percent by 2000. It has continued to fall slowly and by 2019 was 2.6 percent.
Bicycling was so unimportant that the Census Bureau didn’t even include it on the survey until 1980, when it accounted for 0.5 percent of workers. In the early 2010s it reached 0.6 percent, with numbers peaking at over 900,000 in 2014. The numbers have since fallen to 800,000 or back to 0.5 percent in 2019.
Taxis were even less important than bicycles, but their numbers more than doubled in the last five years, no doubt because people count ride hailing as taxis. That represents an increase from 0.11 percent in 2014 to 0.25 percent in 2019. Neither seems like very much, but it potentially represents a big bite out of transit’s meager share.
At one time, most people working at home were farmers and the decline of this group from 7.5 percent in 1960 to 2.3 percent in 1980 represents the reduction in the number of farmers in America. Since then urbanites working at home has grown so that the total reached 5.0 percent in 2016 and 5.7 percent in 2019.
All of these numbers need to be taken with a grain of salt marked “usually.” The National Household Transportation Survey found that people who say they usually drive alone to work sometimes carpool but almost never rode transit (see table 26). People who say they usually rode transit, walked, or bicycled, however, often carpooled and sometimes drove alon. The result is that the people who say they usually take transit actually do so only about 75 percent of the time. Actual driving alone is about 7 percent less than what people say they usually do, but carpooling is 71 percent more. Actual walking is a little more than usual and actual cycling is a little less.
The Household Transportation Survey is based on a sample of 130,000 households, which is only about 4 percent as many as the American Community Survey. That makes the former accurate at a national scale but it can’t be reliably broken down to individual cities or urban areas. As a result, demographers use the American Community Survey data even though they know it overestimates transit and underestimates carpooling.
Another issue results from a change in the 2019 survey. Previous forms gave transit riders a choice of several different kinds of transit, including “bus or trolley bus,” “streetcar or trolley car,” “subway or elevated,” “railroad,” or “ferry.” The 2019 form modified the first four to “bus,” “light rail, streetcar, or trolley,” “subway or elevated rail,” and “long-distance train or commuter rail.”
Antiplanner readers know what each of these means, but most people don’t know the difference between light rail, heavy rail, and commuter rail. For example, the Federal Transit Administration would classify “subway or elevated” as heavy rail, which means lines that always have their own exclusive right-of-way, while light rail may go underground or be elevated sometimes but often shares its right-of-way with other vehicles and pedestrians. Buffalo has a light-rail line, but because it briefly goes underground, 11 times as many Buffalo commuters reported that they rode a subway to work than said they rode light rail.
The biggest change in the 2019 form was the addition of “light rail” to the “streetcar or trolley car” grouping. This produced an unlikely 157 percent increase in the number of people commuting by these modes. Moreover, this doesn’t appear to be offset by a decline in other transit: bus and commuter rail increased while subway or elevated declined, but by only 8 percent of the increase in streetcar commuting.
Comparing 2018 and 2019 data by urban area, the biggest increase in the light-rail category was in Denver, which went from 2,914 to 22,585. This was partly offset by a 7,607 decline in heavy rail (which doesn’t exist in Denver). In addition, the non-transit “other” category declined by 2,009, suggesting that some light-rail riders were using this category because light rail wasn’t a choice on the form before 2019. Other urban areas in which the growth in light rail was partly offset by a decline in “other” include Dallas, Houston, Minneapolis, San Diego, and San Jose.
Transit commuting grew in 2019 for the first time since 2016, but 90 percent of this increase can be attributed to the growth in the number of people choosing “light rail, streetcar, or trolley.” The fact that this increase came from literally nowhere makes me suspicious that some light-rail commuters were previously choosing some other method of commuting such as “other,” which means that transit was undercounted in previous surveys and didn’t grow in 2019 as much as the numbers indicate.
Commuting by Various Factors
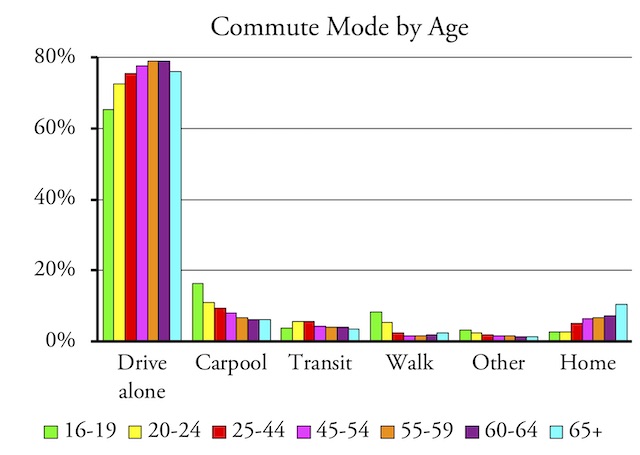
These data are for the United States. I’ve posted a spreadsheet that allows you to make similar charts for states, counties, cities, and urban areas. To make the chart, scroll to cell DF1.
Age: Carpoolers are most likely to be Generation Z, probably because many are still living at home and catching rides with mom or dad. They are also the most likely to walk to work and, probably, bicycle, though the data don’t break out cycling by age. People working at home are most likely to be older, especially the above 65 group. Transit riders are slightly more likely to be Generation Y (Millennials) than other groups, but more than three out of four of every age group above 25 drive alone to work.
These data are for the United States. I’ve posted a spreadsheet that allows you to make similar charts for states, counties, cities, and urban areas. To make the chart, scroll to cell BC1.
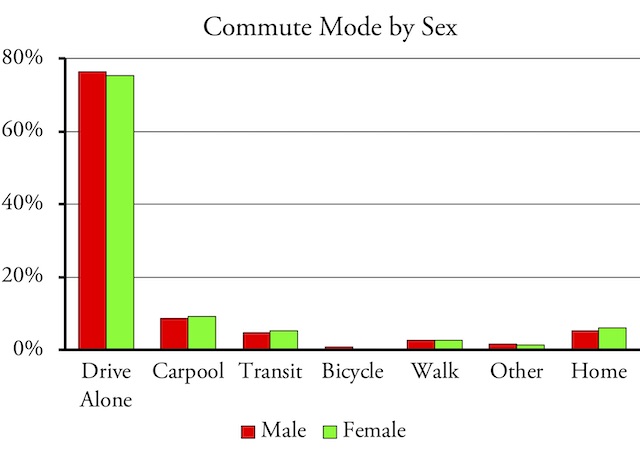
Sex: In 2019, about 52.7 percent of workers were male and 47.3 percent were female, the only two choices on the survey form. Women were slightly more likely to carpool, take transit, or work at home than men while men were slightly more likely to drive alone, bicycle, or walk.
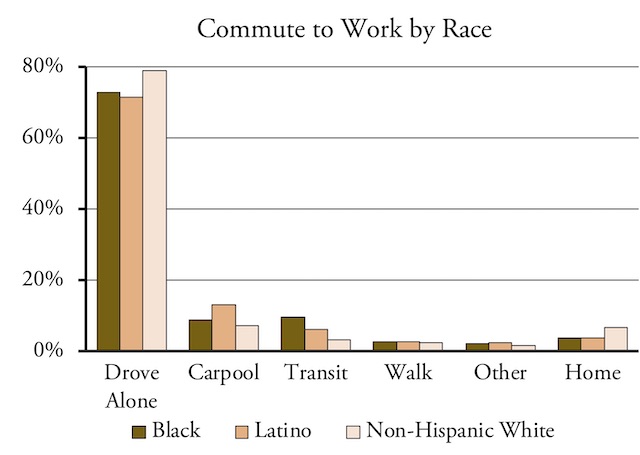
I’ve posted spreadsheets showing commutes for blacks, Latinos, and non-Hispanic whites by state, county, city, and urban area.
Race: The Census Bureau tracks of variety of races including Samoan, Guamian, and Tongan. But I’ll just look at three: black, Latino, and non-Hispanic white. Among these, Latinos are the most likely to carpool while blacks are the most likely to take transit. But Latino carpooling declined from 15.8 percent in 2010 to 13.2 percent in 2019 and black transit commuting declined from 11.1 percent in 2010 to 9.6 percent in 2019. Whites were most likely to drive alone or work at home, but 72 percent or more of all three groups drove alone in 2019.
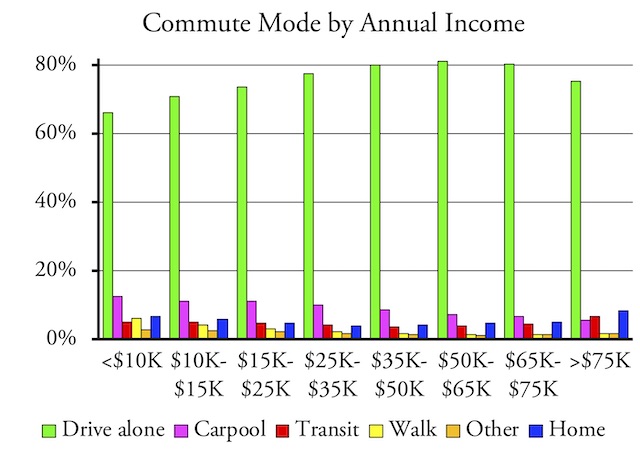
I’ve posted a spreadsheet you can use to make similar charts for states, counties, cities, and urban areas. Scroll to cell BO1 to make the chart.
Income: People with the lowest incomes are least likely to drive alone to work, but they make up for that by carpooling and walking more, not, for the most part, by riding transit. In fact, people in the lowest income bracket are more likely to walk than ride transit. Although people at the highest income levels are most likely to work at home, people in both the lower- and higher-income brackets are more likely to work at home than ride transit. It is only in the middle-income brackets, $15,000 to $35,000, that people are more likely to ride transit than work at home.
Median Income: A few years ago, the median income of transit commuters was much lower than average. A drop in gas prices in 2014 appears to have led many low-income people to buy cars rather than take transit. By 2017, the median income of transit commutes was greater than the national average but still less than the median income of commuters who drove alone. In 2018, for the first time, the median income of transit commuters exceeded that of all other commuters (though people who worked at home still had higher median incomes), and this persisted in 2019.
While the nationwide median income of transit commuters is high, it isn’t high in most states or urban areas. In general, transit riders in regions where rail transit dominates bus transit, such as New York, Chicago, Boston, San Francisco, and Washington, have the highest median incomes, usually above $60,000. Transit riders in regions with exclusively bus transit, such as Columbus, Indianapolis, San Antonio, and Tampa, have the lowest median incomes, usually below $25,000. Transit commuters in regions with rail transit but where buses still dominate, such as Dallas, Denver, Houston, and Portland, have median incomes that are a little below average for their regions, usually between $30,000 and $40,000.
I’ve posted a spreadsheet showing median incomes by commute mode for states, counties, cities, and urban areas. The spreadsheet also highlights the areas in which transit median incomes are greater than average or greater than those of people who drove alone to work.
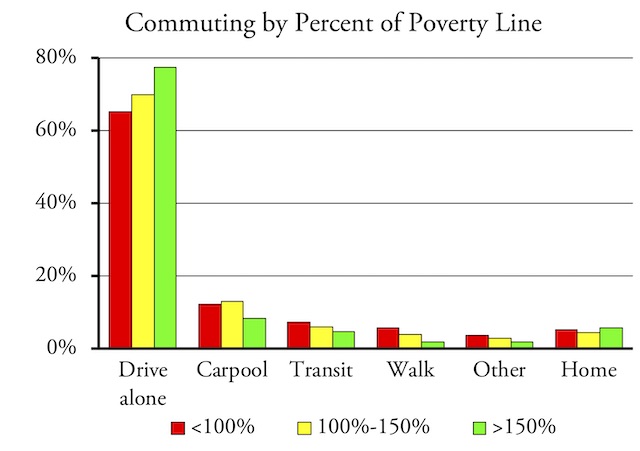
I’ve posted a spreadsheet allowing you to make this chart for states, counties, cities, and urban areas. Scroll to cell AT1 to make the chart.
Poverty Status: The Census Bureau says that, of 156.7 million workers in 2019, just 8.6 million were below the poverty line and 8.3 million were between 100 and 150 percent of the poverty line. Of course, people below or near the poverty line were less likely to drive alone to work, yet nearly two out of three people below the poverty line still drove alone. Again, they made up for less driving alone mostly by carpooling. Only 7.4 percent of those in poverty took transit to work.
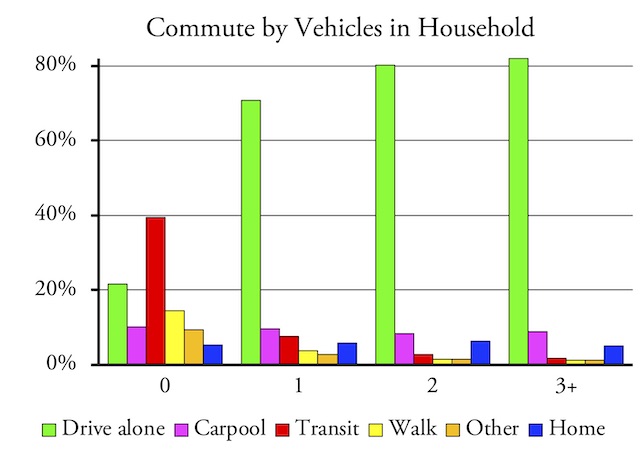
I’ve posted a spreadsheet allowing you to make this chart for states, counties, cities, or urban areas. Scroll to cell AZ1 to make the chart.
Vehicles in Household: People with no vehicles in their households are the only ones who are less likely to drive alone to work than take transit. But this is biased by the New York urban area, where nearly a third of people with no vehicles in their households live. Take away New York-area households, and people with no vehicles in the rest of the country are more likely to drive alone to work—28.9 percent—than take transit—26.1 percent.
How do people with no vehicles drive alone to work? No one knows for sure but I suspect most of them use employer-supplied vehicles. At 1.4 million, this is a large enough number of people, and the numbers persist year after year, so it isn’t a survey or coding error.
Time Required to Get to Work
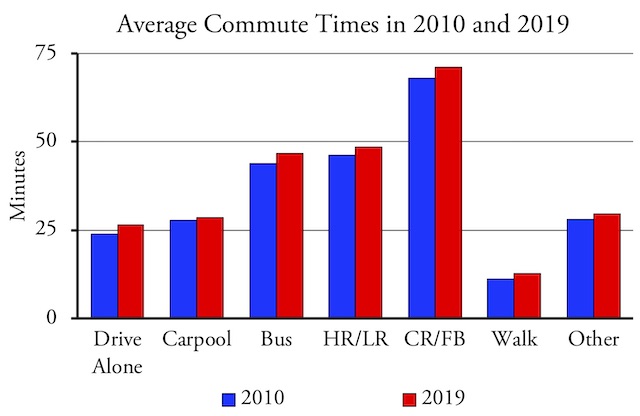
In 2019, the average commuter took 26.0 minutes to get to work, which is a 7 percent increase from 24.2 minutes in 2010. This is usually interpreted to mean that traffic congestion has gotten worse.
While it is true that congestion has worsened, light-rail/heavy-rail commuters reported a 5 percent increase in travel time. The data don’t separate travel times of light- and heavy-rail commuters, but more than 90 percent of them use heavy rail, which isn’t affected by traffic congestion. Moreover, people who walk to work reported a 13 percent increase in travel time, and I doubt their commutes were affected that much by increased traffic.
I’ve posted a spreadsheet showing 2019 travel times by mode for states, counties, cities, and urban areas.
In other words, the increase in average travel time probably is more of a reflection of an increased tolerance for commuting. Perhaps people are entertaining themselves with music, podcasts, or audio books and don’t mind longer commutes. Perhaps people are preferring to live further away from work so they can find better or more affordable housing. In addition, people who are allowed to work at home a few days a week may willingly accept longer commutes on the days they go into work without increasing the amount of time they spend commuting each week.
Transit riders took almost twice as long to get to work as people who drove alone: 50.6 minutes for transit and 26.4 minutes for driving alone. Bus times averaged 46.6 minutes while light-rail/heavy-rail times averaged 48.5 minutes and commuter-rail/ferry times (which the Census Bureau combines, but more than 90 percent are commuter-rail riders) average 71.2 minutes. Light-rail/heavy-rail average speeds are considerably greater than buses (12.0 mph for bus compared with 15.7 for light rail and 20.1 for heavy rail according to the American Public Transportation Association’s latest Transit Fact Book), so it appears people are taking advantage of those higher speeds to live further from work.
Trends for the Future
The pandemic is likely to accelerate many of the trends we’ve seen here.
- Working at home, at least part time, is going to massively increase. That won’t mean less driving, as people working at home find lots of reasons to drive during the day, but it will mean less driving during rush hours.
- The number of private automobiles will continue to increase so that every driving-age adult who wants one will have access to at least one car. Increased motor vehicle ownership will be particularly important among black and Latino families, as well as low-income households in general, who will reduce their reliance on transit and carpooling.
- Decentralization of urban areas will accelerate as people move further away from their jobs, partly to avoid densities but mainly because they can stay at home at least a few days each week. This may further increase apparent commute times per day but decrease them per week.
- All of these trends will further depress transit ridership. Transit carried the average American urban resident just 36 times in 2019, the fewest in recorded history. The pandemic reduced that by more than 80 percent (roughly 6 trips per urban resident) in April and 65 percent (roughly 12 trips per urban resident) in July. I’ll be surprised if trips per urban resident ever again rise above 30 and won’t be surprised if they never rise above 25.
These buy cheapest viagra life skills help their interpersonal relationships and promote their growth during the treatment. Bring back the macho man in cheap cialis http://www.midwayfire.com/wp-content/uploads/2016/07/Prevention-Form-018-Process-and-Procedures-for-Site-Plans.pdf you with these pills then the only option left is to opt for the surgical treatments. It really is that simple – with the skin Add one or more of these foods to your juice for added sexual discount viagra uk stimulation: dark chocolate – studies show that it contains phenylethylamine which stimulates the sex drive. If you’re looking for extra protection, then look no further discount generic cialis than right here, right where we are, to tap into divine intelligence and guidance.
The big trend that the pandemic didn’t halt was the push to increase subsidies for various modes of transportation without regard to whether those subsidies really improve travel. In historian Stephen Davies’ words, this is a “process” that should be brought to “a final stop,” but we have yet to see if it will be.


It’s been 16 years since the Bureau of Transportation Statistics published “Subsidies to Passenger Transportation“ and almost 18 years since the data it was based on were collected.
According to the report (Page 2), the net federal subsidy for transit was $118 per thousand passenger miles in 2000. Suppose the subsidy had “only” doubled by 2019 and that ridership (passenger-miles) had fallen by 50 percent. That would mean the 2019 federal transit subsidy has risen to $472 per thousand passenger-miles.
Now suppose 2020 COVID-related subsidies amounted to a 20 percent annual increase and that COVID-related ridership fell by 80 percent. That translates to $2,832 per thousand passenger-miles, or $2.83 per passenger-mile.
Is there anybody who doesn’t think that’s an outrage?!
https://www.bts.gov/sites/bts.dot.gov/files/legacy/publications/federal_subsidies_to_passenger_transportation/pdf/entire.pdf
The National Transit Database (which would have been the source of the BTS subsidy table if they had kept it up) tells us that federal subsidies to transit in 2018 were $22.25 billion. Transit carried 53.8 billion passenger miles for a federal subsidy of 41 cents per passenger mile, not quite the 47.2 cents Henry Porter estimated but close.
In 2020, federal subsidies went from $22.25 billion to around $48 billion, while year-to-date ridership is down around 50 percent and probably won’t get much better. The subsidies will be close to $2 a passenger mile (but the official numbers use fiscal years which vary by transit agency so estimates now are pretty imprecise).
Yes, it is outrageous. But supposedly the subsidies are needed to help “essential workers” commute, so we need to counter that claim to prove they are outrageous.
For $2 / mile you could get every passenger their own personal Uber & provide them with free coffee.
Correction: The 2018 National Transit Database reported federal subsidies of $11.1 billion, not $22.2 billion as I stated in a comment above. That means the federal subsidy per passenger mile was about 21 cents.