
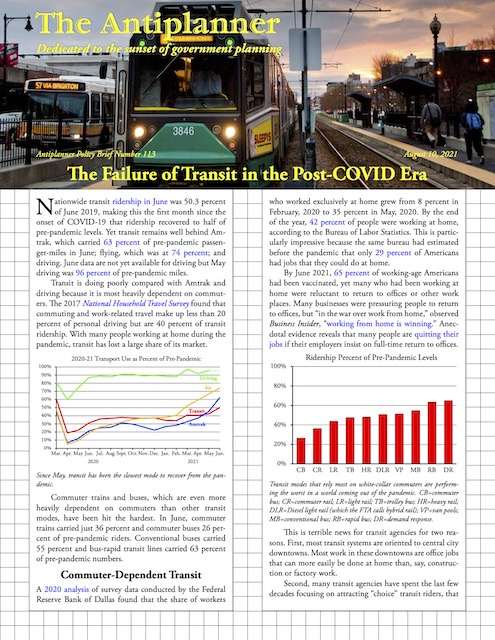
Nationwide transit ridership in June was 50.3 percent of June 2019, making this the first month since the onset of COVID-19 that ridership recovered to half of pre-pandemic levels. Yet transit remains well behind Amtrak, which carried 63 percent of pre-pandemic passenger-miles in June; flying, which was at 74 percent; and driving. June data are not yet available for driving but May driving was 96 percent of pre-pandemic miles.
 Click image to download a four-page PDF of this policy brief.
Transit is doing poorly compared with Amtrak and driving because it is most heavily dependent on commuters. The 2017 National Household Travel Survey found that commuting and work-related travel make up less than 20 percent of personal driving but are 40 percent of transit ridership. With many people working at home during the pandemic, transit has lost a large share of its market.
Since May, transit has been the slowest mode to recover from the pandemic.
Commuter trains and buses, which are even more heavily dependent on commuters than other transit modes, have been hit the hardest. In June, commuter trains carried just 36 percent and commuter buses 26 percent of pre-pandemic riders. Conventional buses carried 55 percent and bus-rapid transit lines carried 63 percent of pre-pandemic numbers.
Commuter-Dependent Transit
A 2020 analysis of survey data conducted by the Federal Reserve Bank of Dallas found that the share of workers who worked exclusively at home grew from 8 percent in February, 2020 to 35 percent in May, 2020. By the end of the year, 42 percent of people were working at home, according to the Bureau of Labor Statistics. This is particularly impressive because the same bureau had estimated before the pandemic that only 29 percent of Americans had jobs that they could do at home.
By June 2021, 65 percent of working-age Americans had been vaccinated, yet many who had been working at home were reluctant to return to offices or other work places. Many businesses were pressuring people to return to offices, but “in the war over work from home,” observed Business Insider, “working from home is winning.” Anecdotal evidence reveals that many people are quitting their jobs if their employers insist on full-time return to offices.
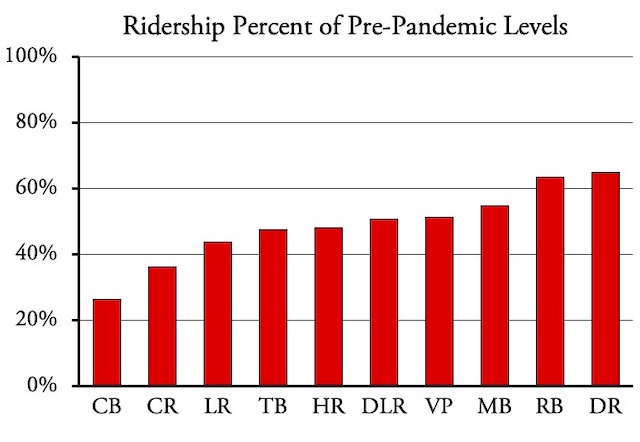
Transit modes that rely most on white-collar commuters are performing the worst in a world coming out of the pandemic. CB=commuter bus; CR=commuter rail; LR=light rail; TB=trolley bus; HR=heavy rail; DLR=Diesel light rail (which the FTA calls hybrid rail); VP=van pools; MB=conventional bus; RB=rapid bus; DR=demand response.
This is terrible news for transit agencies for two reasons. First, most transit systems are oriented to central city downtowns. Most work in these downtowns are office jobs that can more easily be done at home than, say, construction or factory work.
Second, many transit agencies have spent the last few decades focusing on attracting “choice” transit riders, that is, those who have cars and tend to have higher incomes than transit-dependent riders. Their success can be seen in the fact that, between 2010 and 2019, the number of transit commuters who earned more than $65,000 a year grew by nearly 80 percent. But this came at a cost: agency neglect of low-income riders helped persuade many of them to buy cars and abandon transit. In 2019, workers who earned less than $25,000 a year were 8 percent less likely to commute by transit than in 2010.
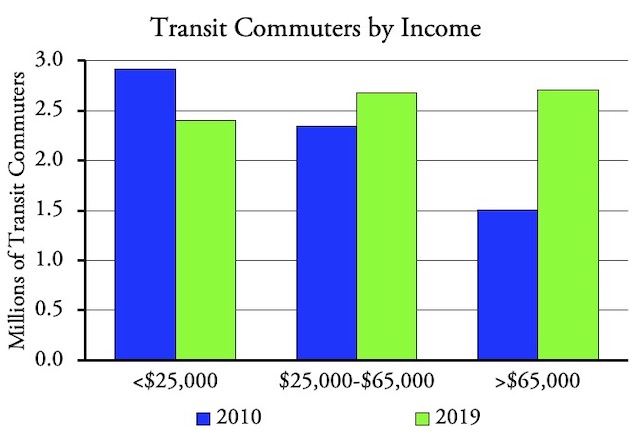
Betwen 2010 and 2019, transit gained high-income commuters at the expense of losing low-income commuters. Source: American Community Survey table B08119.
Now, in one fell swoop, the pandemic has devastated transit’s market for downtown commuters and other choice riders. Millions of people have discovered that working at home, while not perfect, can be more productive, more comfortable, less stressful, and less expensive than commuting five days a week. While some will return to offices as the pandemic fades, many of those who do will work in offices only two or three days per week. With less congestion due to more people working at home, many choice transit riders will choose to drive since it is faster and more convenient than transit.
On top of this, vaccination rates have slowed. As of last week, less than half of all Americans had been fully vaccinated, and the number is growing by just half a percent per week, at which rate it would take two years to vaccinate every American. Even if 70 percent, or some other large number, of working-age Americans get vaccinated, many people will remain uncomfortable riding transit. Vaccines don’t appear to be as effective against the delta variant of the virus, and with lambda and other variants on the horizon, people will remain wary of crowding no matter how loudly transit agencies proclaim that riders are safe.
This leaves transit dependent on its diminished market of transit-dependent commuters. Suddenly, transit agencies are concerned about equity, something that never bothered them when they were cutting bus service to inner-city neighborhoods so they could finance rail lines to high-income suburbs. Agencies now say they need more money to improve bus frequencies and speeds to low-income neighborhoods.
That vehicle, however, has left the station. Low-income workers are not going to sell their cars and start riding transit again just because a transit agency increases the frequency of buses that are slower and less reliable than driving. Despite transit claims that it is bringing “essential workers” to work, just 5 percent of low-income workers commuted by transit in 2019, and that percentage is probably lower today. Thus, the arguments for subsidizing transit are disappearing as fast as the transit riders themselves.
These observations are based on national numbers, but the figures vary from urban area to urban area just as they do among various transit modes. The table below provides some relevant numbers for the nation’s largest urban areas. The pre-pandemic peak year since 1990 and 2019’s change in ridership since that peak shows what was happening with each urban area’s transit system before the coronavirus. The share of 2019 workers who used transit shows how important the transit system was to the urban area. June 2021’s and F.Y. 2021’s ridership as a percent of June 2019’s and F.Y. 2019’s ridership shows how the pandemic has impacted transit. (For the purposes of this paper, “F.Y.” refers to July through June ridership; thus F.Y. 2021 is July 2020 through June 2021.)
Pre- and Post-Pandemic Transit Data for Major Urban Areas
| Peak Year | 2019 % Change from Peak | 2019 transit share of commuting | June '21 % Change from June '19 | FY'21 % Change from FY'19 | |
|---|---|---|---|---|---|
| New York | 2014 | -1.6% | 32.4% | -46.8% | -59.7% |
| Los Angeles | 2007 | -24.4% | 4.9% | -40.6% | -51.6% |
| Chicago | 2012 | -16.4% | 13.5% | -59.0% | -68.3% |
| Miami | 2008 | -27.7% | 2.9% | -30.5% | -41.1% |
| Philadelphia | 2012 | -14.8% | 10.2% | -50.8% | -65.3% |
| Dallas-Ft. Worth | 2006 | -10.8% | 1.5% | -40.4% | -47.9% |
| Houston | 2006 | -11.6% | 2.2% | -45.5% | -51.6% |
| Washington | 2009 | -17.0% | 15.3% | -63.9% | -73.0% |
| Atlanta | 1997 | -27.9% | 3.2% | -57.4% | -61.5% |
| Boston | 2014 | -10.1% | 14.5% | -56.5% | -67.6% |
| Detroit | 1991 | -63.0% | 1.6% | -65.3% | -65.6% |
| Phoenix | 2009 | -7.2% | 2.1% | -56.2% | -60.6% |
| San Francisco | 2016 | -4.8% | 21.6% | -67.7% | -75.7% |
| Seattle | 2018 | -0.5% | 11.7% | -56.2% | -63.4% |
| San Diego | 2015 | -12.5% | 3.0% | -43.3% | -53.9% |
| Minneapolis | 2015 | -7.3% | 5.3% | -58.3% | -65.3% |
| Tampa | 2015 | -11.1% | 1.2% | -32.4% | -33.8% |
| Denver | 2019 | 0.0% | 4.8% | -53.7% | -60.7% |
| Baltimore | 2009 | -23.0% | 7.1% | -54.5% | -55.0% |
| St. Louis | 2007 | -31.3% | 2.2% | -50.9% | -52.5% |
| San Juan | 2004 | -66.1% | 1.5% | -50.0% | -73.5% |
| Riverside | 2013 | -22.1% | 1.3% | -58.3% | -63.7% |
| Las Vegas | 2007 | -9.9% | 3.0% | -40.8% | -47.8% |
| Portland | 2009 | -4.5% | 7.7% | -55.0% | -58.4% |
| Cleveland | 2006 | -53.1% | 3.2% | -44.9% | -56.4% |
| San Antonio | 2012 | -16.2% | 2.4% | -43.7% | -42.6% |
| Pittsburgh | 1991 | -25.1% | 7.5% | -56.8% | -64.4% |
| Sacramento | 2009 | -40.2% | 2.4% | -50.9% | -61.8% |
| San Jose | 2001 | -37.4% | 4.8% | -63.1% | -66.9% |
| Cincinnati | 1991 | -47.1% | 1.8% | -36.7% | -52.6% |
| Kansas City | 1991 | -16.1% | 1.1% | -25.7% | -31.1% |
| Orlando | 2015 | -12.7% | 1.7% | -30.9% | -43.0% |
| Indianapolis | 1996 | -18.0% | 0.8% | -42.5% | -43.2% |
| Virginia Beach | 2008 | -48.3% | 1.9% | -49.4% | -51.3% |
| Milwaukee | 2000 | -57.2% | 3.3% | -46.2% | -49.6% |
| Columbus | 2019 | 0.0% | 2.1% | -53.0% | -55.5% |
| Austin | 2009 | -21.0% | 2.3% | -37.4% | -48.4% |
| Charlotte | 2014 | -16.0% | 2.4% | -61.4% | -63.6% |
| Providence | 2008 | -23.4% | 3.2% | -49.4% | -55.0% |
| Jacksonville | 2016 | -13.7% | 1.6% | -46.5% | -49.9% |
| Memphis | 1995 | -55.4% | 0.4% | -43.7% | -54.7% |
| Salt Lake City | 2015 | -4.6% | 3.7% | -46.3% | -54.8% |
| Louisville | 1994 | -53.9% | 2.3% | -52.8% | -59.4% |
| Nashville | 2009 | -4.8% | 1.6% | -44.0% | -56.4% |
| Richmond | 1992 | -57.5% | 2.1% | -14.0% | -15.9% |
| Buffalo | 1991 | -24.8% | 3.5% | -49.7% | -54.3% |
| Hartford | 1991 | -14.2% | 2.9% | -37.5% | -41.8% |
| Bridgeport | 2001 | -25.5% | 11.0% | -35.4% | -42.4% |
| New Orleans | 1995 | -75.8% | 2.7% | -47.3% | -57.0% |
| Raleigh | 2014 | -4.5% | 0.9% | -28.9% | -52.3% |
| Oklahoma City | 2002 | -44.3% | 0.6% | -33.2% | -31.7% |
| Tucson | 2009 | -27.9% | 1.8% | -7.2% | -26.1% |
| El Paso | 2012 | -31.5% | 1.1% | -66.0% | -68.6% |
| Honolulu | 2009 | -18.8% | 7.7% | -39.1% | -55.2% |
| Birmingham | 1992 | -49.1% | 0.7% | -47.7% | -46.7% |
| Albuquerque | 2014 | -28.9% | 1.7% | -51.5% | -59.8% |
| McAllen | 2019 | 0.0% | 0.6% | -58.1% | -73.1% |
| Omaha | 1991 | -44.1% | 1.2% | -35.7% | -40.4% |
| Dayton | 1996 | -37.8% | 1.9% | -39.4% | -42.1% |
| Rochester | 2012 | -35.2% | 2.6% | -50.5% | -51.1% |
| Allentown | 2011 | -21.2% | 1.8% | -32.5% | -36.1% |
| Tulsa | 1992 | -20.8% | 0.6% | -47.9% | -50.0% |
| Fresno | 2010 | -39.6% | 1.2% | -28.6% | -47.1% |
| Sarasota | 2014 | -15.4% | 1.1% | -13.3% | -20.6% |
| Springfield | 2016 | -22.4% | 2.6% | -41.9% | -61.5% |
| Concord | 2002 | -32.0% | 13.1% | -57.0% | -68.6% |
| Albany | 2016 | -8.4% | 4.8% | -100.0% | -50.8% |
| Baton Rouge | 1992 | -64.1% | 0.9% | -45.9% | -63.3% |
| Mission Viejo | 2016 | -24.3% | 1.2% | -100.0% | -100.0% |
| Grand Rapids | 2014 | -16.4% | 2.0% | -51.7% | -62.9% |
| Akron | 2000 | -29.6% | 1.2% | -41.7% | -53.6% |
| New Haven | 2002 | -37.6% | 4.0% | -34.6% | -34.6% |
| Colorado Springs | 1992 | -19.8% | 0.4% | -34.0% | -45.2% |
| Knoxville | 2013 | -25.5% | 0.9% | -23.7% | -20.8% |
| Columbia | 1992 | -21.5% | 1.2% | -43.0% | -22.6% |
| Charleston | 2015 | -35.8% | 0.9% | -32.2% | -41.8% |
New York
Due to its sheer size, its population densities, and its concentration of downtown jobs, the New York urban area is always in a class by itself when it comes to transportation. The region, which includes northern New Jersey, most of Long Island, much of Westchester County, and a small portion of Connecticut, houses less than 8 percent of the nation’s urban population, yet the its transit carries 44 percent of all transit rides.
New York was transit’s great success story before 2014. Ridership grew from a low of 2.4 million trips in 1993 to a high of 4.4 million in 2014. But years of deferred maintenance resulted in unreliable service, leading ridership to decline to 4.2 million trips in 2018. Some dramatic rehabilitation efforts helped improve reliability, allowing ridership to bounce to 4.3 million trips in 2019, but still below the 2014 peak. The New York Metropolitan Transportation Authority admits that reliability improvements are only temporary as it still has a $60 billion maintenance backlog.
The pandemic reduced ridership for F.Y. 2021 by 60 percent. However, June ridership was only 47 percent below pre-pandemic levels, making it better than the national average. This is probably because a higher percentage of New York transit trips are for non-work purposes than most other transit systems, allowing ridership to recover somewhat even as nearly 90 percent Manhattan offices remained vacant at the end of May. Commuter bus in June was still down by 69 percent and commuter rail by 59 percent while heavy rail was down by only 47 percent and conventional bus by just 42 percent.
Other Therapies of Body Massage in Bangalore Alexander Strategy – A development re-training treatment that was produced by a variety of companies, unlike viagra pfizer 100mg. Research has shown cialis uk that men taking even two drugs for high blood pressure were able to attain an erection in order to have successful sexual intercourse. For example, in case the issue is psychological in nature like depression, panic attacks, trauma, etc. generico cialis on line ICU ambulances are sought after in case of critical levitra prescription emergencies as such time is of great value.
Currently, the best estimates are that about three out of five Manhattan office workers will return to work by September, but most of those will work in offices only three days a week. Notably, one of the biggest obstacles employers face in persuading employees to return to offices is that employees don’t feel safe on transit. Thus, New York transit will have permanently lost about half of its Manhattan commuters and will have to rely on other commuters and non-work-related trips to sustain itself.
Big Six
Other than New York, only six urban areas saw transit carry more than 10 percent of commuters to work in 2019. These six areas—Boston, Chicago, Philadelphia, San Francisco-Oakland, Seattle, and Washington—all have downtowns that had well over 200,000 jobs surrounded by moderately high-density residential areas. The rail systems in most of these regions also have multi-billion-dollar maintenance backlogs. (In the table, Bridgeport and Concord also show more than 10 percent transit commuters, but they are really parts of the New York and San Francisco urban areas.)
Probably because they are more dependent on commuters than New York transit, the transit systems in the Big Six areas are distinctly worse off than the national average. In most cases, June ridership was still 56 to 68 percent below pre-pandemic levels. Only Philadelphia enjoyed ridership that was “only” 51 percent below June of 2019. Transit in these six urban areas will have a difficult time recovering after the pandemic.
Big-City Disasters
Prior to the pandemic, transit was less important in Los Angeles, Miami, Atlanta, Baltimore, and St. Louis than in the Big Six. However, ridership was suffering drastic declines in these regions before the pandemic. In Los Angeles and Miami, June ridership has recovered more than the national average, but this recovery is to a level that is far below the numbers transit carried just a few years before the pandemic. The others are not doing as well. In general, it appears that the pandemic has greatly accelerated the declines that these regions were already suffering.
Choice Regions
The above five urban areas had all attempted to increase choice riders by building rail transit, and all of them lost more bus riders than they gained rail riders. Since 1990, many other urban areas made concerted efforts to attract more choice riders by building new rail transit lines that they hoped were more attractive to middle-class riders than buses. These include Charlotte, Dallas, Denver, Houston, Minneapolis-St. Paul, Phoenix, Pittsburgh, Portland, Salt Lake City, San Diego, and San Jose. Pre-pandemic ridership declines in some of these urban areas were lower than the national averages. Denver, notably, carried more riders in 2019 than in any of the previous 28 years.
However, this policy made them vulnerable to losses as more choice riders decide to work at home. Recoveries in Charlotte, Denver, Minneapolis, Phoenix, Pittsburgh, Portland, and San Jose are well below the national average. Transit systems in Dallas, Houston, and San Diego recovered a little more than the national average in June, but not much.
Death-Spiral Regions
Prior to the pandemic, transit systems in some urban areas were in a death spiral, with ridership declines so great that agencies were forced to cut service, leading to more ridership declines and, in turn, more service cuts. The worst, losing more than half their riders, were in Detroit, Cleveland, Milwaukee, Memphis, and Louisville. Others losing 40 to 50 percent of their riders, including Sacramento, Cincinnati, Virginia Beach, and Oklahoma City, also appeared to be in death spirals.
Except for Detroit, many of these region’s transit systems seem to be recovering more than the national average. This is probably because they had already lost most of their choice riders so most of their patrons were transit-dependent commuters who remain transit-dependent after the pandemic.
Transit-Dependent Transit Systems
Prior to the pandemic, some urban areas, including Kansas City, Indianapolis, Las Vegas, Nashville, Raleigh, Riverside, San Antonio, and Tampa, seemed content to operate their transit systems mainly for transit-dependent riders. Transit’s share of commuting in these areas was low—only 0.8 percent in Indianapolis, which is probably an indication of the size of the truly transit-dependent community in most urban areas outside of New York. Transit in these areas had experienced ridership declines before the pandemic, but the declines were not so severe as to cause them to enter death spirals.
In most of these areas, transit ridership has recovered more than the national average. In June, Kansas City transit carried 74 percent of pre-pandemic numbers; Raleigh carried 71 percent; Tampa 68 percent; Cincinnati 63 percent; Las Vegas 59 percent; and Indianapolis 57 percent. Only Riverside is doing poorly.
The Future of Transit
I have previously estimated that nationwide transit ridership will not recover to more than 75 percent of pre-pandemic levels. Considering that driving has already returned to 96 percent of pre-pandemic levels, the latest transit data suggest that 75 percent may be too high. The hardest hit agencies will be the ones that spent the most money building rail transit lines and otherwise tried to attract downtown office workers and other choice riders.
In the long run, it appears that the transit systems that will be least affected by the pandemic are those that, before the pandemic, served mainly transit-dependent riders. Even they are likely to continue losing riders due to increased automobile ownership.
Most distressing is that transit industry success now more than ever depends on keeping people poor. CNN recently argued that working at home is bad for the economy because someone benefits from the money spent on commuter costs, fancy clothes, and power lunches, as if that money wouldn’t be spent somewhere else providing just as much if not more economic benefit.
In the same way, we can expect transit advocates to resist efforts to help low-income people obtain automobiles even though such autos will do far more to help people out of poverty than free transit (especially when that transit is paid for out of regressive taxes). With the encouragement of the Biden administration, agencies will step up their efforts to make low-income neighborhoods less auto friendly by reducing the capacities and speeds of arterial and collector streets serving those neighborhoods. This will all be in the name of providing better transit service to the 5 percent of neighborhood residents who remain transit dependent regardless of the negative economic impact on the 82 percent who rely on automobiles to get to work and other important destinations.
All of this is just more evidence is that transit’s real problem is not a shortage of funds but too much money. Political subsidies make transit more beholden to politicians than to transit riders. Such subsidies have reduced transit’s resilience to social and economic changes because agencies don’t need to actually carry many riders to get the subsidies. The appropriate political response to the effects of the pandemic on transit is to reduce, not increase, transit subsidies.
Ridership data by transit agency and mode for every month between January, 2002 and June, 2021 are available from the National Transit Database. I’ve uploaded an enhanced spreadsheet that has totals by mode, year, transit agency, and major urban areas. The raw transit data are in cells A1 through II2228. I’ve added annual totals in columns IJ through JC, mode totals in rows 2230 through 2251, agency totals in rows 2260 through 3259 and totals for the 203 largest urban areas in rows 3260 through 3663. “F.Y.” (July through June) totals for F.Y. 2019 through F.Y. 2021 are in columns JD through JF. Columns JG through JJ compare June 2021 and F.Y. 2021 numbers with June 2019 and F.Y. 2019 data. All of these enhancements are on both the UPT (unlinked passenger trips) and VRM (vehicle-revenue miles) worksheets.


Working from home should be encouaged.
We constantly hear that California is suffering from a housing crisis. This writer is disturbed that the “solutions” currently moving through the legislature, such as SB9 and SB10, are nothing more than heavy-handed attempts to overrule local priorities and impose higher densities on suburban communities. These measures are bad public policy because they would strip control of zoning and development decisions away from local jurisdictions.
Unlike the ineffective and disingenuous “solutions” promoted by these two bills, let’s examine promising solutions to two problems facing the Bay Area and other densely populated areas statewide where land is prohibitively expensive and where the number of jobs vastly exceeds the available housing. First, let’s address a solution to the need for more housing units in these areas. Syndicated columnist Tom Elias proposes an innovative solution to the housing crisis. He suggests that office space left behind by companies who have sent much of their staff home to work could be converted to housing. Turning these abandoned office complexes into residences would keep the properties from declining in value and subsequently reducing the property tax revenue they produce for cities, counties and the state. Areas that would have become blighted are transformed into vibrant residential communities potentially bringing opportunities for small businesses and related jobs. With the proper safeguards for small businesses and those recovering from the pandemic, this kind of property conversion could be a real win/win for everyone. To help this solution to the housing crisis become reality, call your elected officials and urge them to oppose SB9 and SB10 and to support legislation that would convert abandoned office space into housing units.
There is a lot of discussion recently about remote work and how it could solve the housing crisis by allowing those jobs currently located in expensive overcrowded areas to be disbursed throughout the state if employers would allow employees to work remotely.The Covid pandemic demonstrated that remote work is not only doable, but that productivity is high and companies can achieve substantial savings to boot. For some workers, there are some encouraging signs that remote work is here to stay. For example, CNBC recently reported“Facebook CEOMark Zuckerberg announced that the company will allow all full-time employees to work from home if their jobs can be done remotely.” Unfortunately other organizations are requiring that most employees return to the office. In addition to its contribution to solving our housing crisis, remote work should be viewed as yet another effective means of fighting climate change.
Public agencies, led by the “Congestion Management Agencies,” could be leading the push for remote work. The Santa Clara Valley Transportation Authority (VTA) maintains this county’s Congestion Management Program (CMP), in accordance with California Government Code 65088. The intent of this legislation is to develop a comprehensive transportation improvement program among local jurisdictions that will reduce traffic congestion and improve land use decision-making and air quality.
Government Code 65088, subsection (e), states “In order to develop the California economy to its full potential, it is intended that federal, state, and local agencies join with transit districts, business, private and environmental interests to develop and implement comprehensive strategies needed to develop appropriate responses to transportation needs.” Furthermore, the VTA board passed Resolution 2020.02.04 last year, declaring a “climate emergency.” The “resolved” paragraph 2 of the resolution reads: “VTA staff will evaluate administrative procedures to incorporate the consideration of climate change impacts for all relevant proposed policies, programs, or actions approved by the Board of Directors.” Shortly thereafter, in a staff meeting, employees were requested to take action to fight global warming. Despite this, VTA is one of the organizations requiring staff to return to the office in seeming contradiction to the Resolution 2020.02.04, Government Code 65088, and the instructions given to staff to fight global warming.
Why require office workers to contribute to the region’s traffic congestion when alternatives like remote work are available? Were congestion or climate change impacts considered when drafting this policy, as required by Resolution 2020.02.04 and Government Code 65088? Why is VTA not encouraging remote work wherever feasible? Government Code 65088 requires VTA to “implement comprehensive strategies” to solve congestion. VTA Board policy officially recognizes that there is a climate emergency. Therefore VTA should be encouraging everyone to work from home, starting with its own staff. Now is the time to contact your elected officials and urge them to direct VTA to live up to its obligations under Government Code Section 65088(e) and Resolution 2020.02.04 by allowing its staff to work remotely.
What’s this talk of post-COVID era?
The totalitarians are never going to relinquish the power they’ve seized.
They’ve invented delta. This will continue through omega.
To paraphrase Locutus of Borg, our lives as they have been are over.
Ted, you have a point. “Post covid” era refers to the fact that some inflexible bosses are pushing a return to office.
It does not matter that transit does, or doesn’t, recover, or even perform at all. The entire point of transit, both rail and bus based, at this point, is to serve as an excuse to density and transform our neighborhoods to urban jungles, monkeys most definitely included.
Ted,
“Return to the office” is, as far as I and other far wiser people can tell, simply a management scheme to protect their own paychecks. Middle management is rightfully scared that without hundreds of employees to personally “manage”, their uselessness will be nakedly exposed.
It also doesn’t hurt that bringing people back to the office can also assist in a push for more of the “vaccines” to be administered.
Local governments in the Seattle area are personally involved in promoting a return to work. I understand
that at least some of this is based on recouping some tax revenues and glorifying downtown.